JVM - Overview Report
The prime concern of administrators of Java applications is knowing how well the application was functioning over a period of time, and how to troubleshoot issues (if any) in the performance of these applications. For this purpose, eG Enterprise offers a JVM – Overview report. By generating this report, administrators gain considerable knowledge on the overall performance, availability, incidents, top issues and resource constraints in JVMs in their environment over a period of time. Administrators can also historically analyze the CPU, memory, GC and thread incidents, figure out the times when the incidents peaked and start troubleshooting the issues effectively. The Top N JVMs that are impacted by blocked threads, runnable threads, garbage collection etc can also be identified using this report.
To generate the JVM - Overview report, do the following:
- Select the Overview option by following the menu sequence: REPORTS BY FUNCTION -> Domain-specific Reports -> Web Application Monitoring-> Java.
-
Figure 1 will then appear.
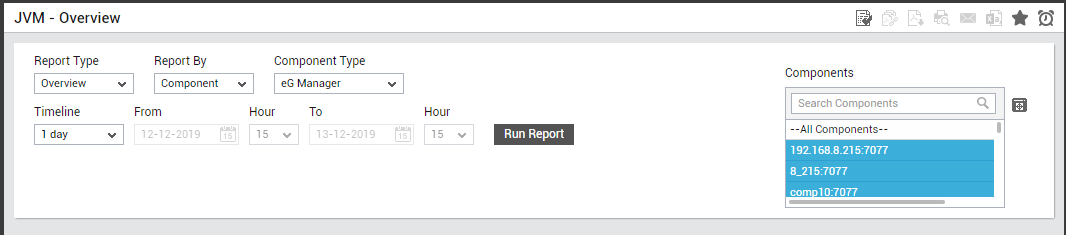
Figure 1 : Specifying the criteria for generating the JVM - Overview report
- By default, Overview option is chosen from the Report Type list indicating that the report will be generated as a graph. However, to generate a tabular format of the report, select the Detailed option from this list.
-
To ease the pain involved in choosing the components for report generation, eG Enterprise provides a Report By list. The options provided by the Report By list box are discussed hereunder:
- Zone: By default, the Zone option is chosen from the Report By list - this indicates that by default, the list will display all the managed components in the chosen zone. Select the zone to which the components of interest to you belong from the Zone drop-down list.
- Component: Select this option to generate a report on the components that are managed in the target environment.
- Service: Select this option if the components for which a report is to be generated are involved in the delivery of a business service. Then, select a Service.
- Segment: Choose this option if the components to be evaluated are part of a segment. Then, pick a Segment for analysis.
- Next, choose a Component Type. This list lists all the components that are executing on JVM, by default. The All Component Types option is chosen by default, from this list. The Components list is then populated with the components pertaining to the chosen Component Type. If the Components list consists of too many components, then viewing all the components and selecting the ones you need for report generation could require endless scrolling. To avoid this, you can click the
 button next to the Components list. The COMPONENTS pop up window will then appear using which you can view almost all the components in a single interface and Select the ones for which the report is to be generated. You can narrow your search further by using the Search text box. Specify the whole/part of the component name to search for in this text box, and click the
  icon next to it.
 -
Then, specify the Timeline for generating the report. You can either provide a fixed time line such as 1 hour, 2 days, etc., or select the Any option from the list to provide a From and To date/time for report generation.
Note:
For every user registered with the eG Enterprise system, the administrator can indicate the maximum timeline for which that user can generate a report. Once the maximum timeline is set for a user, then, whenever that user logs into eG Reporter and attempts to generate a report, the Timeline list box in the report page will display options according to the maximum timeline setting of that user. For instance, if a user can generate a report for a maximum period of 3 days only, then 3 days will be the highest option displayed in the Timeline list - i.e., 3 days will be the last option in the fixed Timeline list. Similarly, if the user chooses the Any option from the Timeline list and proceeds to provide a start date and end date for report generation using the From and To specifications, eG Enterprise will first check if the user's Timeline specification conforms to his/her maximum timeline setting. If not, report generation will fail. For instance, for a user who is allowed to generate reports spanning over a maximum period of 3 days only, the difference between the From and To dates should never be over 3 days. If it is, then, upon clicking the Run Report button a message box will appear, prompting the user to change the From and To specification.
-
In addition to the settings discussed above, this report comes with a set of default specifications. These settings are hidden by default. If you do not want to override these default settings, then you can proceed to generate the report by clicking the Run Report button soon after you pick one/more components for report generation. However, if you want to view and then alter these settings (if required), click on the
 icon. The default settings will then appear in the MORE OPTIONS drop down window (See Figure 2). The steps below discuss each of these settings and how they can be customized.
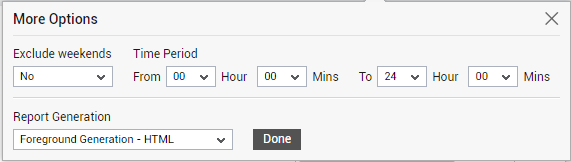
Figure 2 : The default settings for generating the JVM - Overview report
-
If the timeline specified for the report needs to exclude the data collected during the Weekends, then set Exclude weekends to Yes. If not, select No.
Note:
You can configure the days of the week that need to be considered as a ‘weekend’ using the Days parameter in the[EXCLUDE_WEEKEND] section in the eg_report.ini file (in the <EG_INSTALL_DIR>\manager\config directory). The Days parameter is set to Saturday,Sunday by default. To change this weekend specification, enter two other days of the week against the Days parameter.
- Specify the start time and end time for report generation against the Time period field (see Figure 2).
-
In large environments, reports generated using months of data can take a long time to complete. Administrators now have the option of generating reports on-line or in the background. When a report is scheduled for background generation, administrators can proceed with their other monitoring, diagnosis, and reporting tasks, while the eG manager is processing the report. This saves the administrator valuable time. To schedule background processing of a report, you can either select the Background Save - PDF or the Background Save - CSV option from the Report Generation list. In this case, a Report Name text box will appear, where you would have to provide the name with which the report is to be saved in the background. To process reports in the foreground, select the Foreground Generation - HTML option from this list.
Note:
- The default selection in the Report Generation list will change according to the Timeline specified for the report. If the Timeline set is greater than or equal to the number of days specified against the MinDurationForReport parameter in the [BACKGROUND_PROCESS] section of the eg_report.ini file, then the default selection in the Report Generation list will be Background Save - PDF. On the other hand, if the Timeline set for the report is lesser than the value of the MinDurationForReport parameter, then the default selection in the Report Generation list will be Foreground. This is because, the MinDurationForReport setting governs when reports are to be processed in the background. By default, this parameter is set to 2 weeks - this indicates that by default, reports with a timeline of 2 weeks and above will be processed in the background.
- The Report Generation list will appear only if the EnableBackgroundReport flag in the [BACKGROUND_PROCESS] section of the eg_report.ini file (in the [EG_INSTALL_DIR]\manager\config directory) is set to Yes.
- Click the Done button if any changes were made to the More Options drop down window.
- Finally, click the Run Report button to generate the report.
-
If the option chosen from the Report Generation list is Foreground Generation - HTML and if the Report Type is chosen as Overview, then, clicking on the Run Report button will invoke Figure 3.
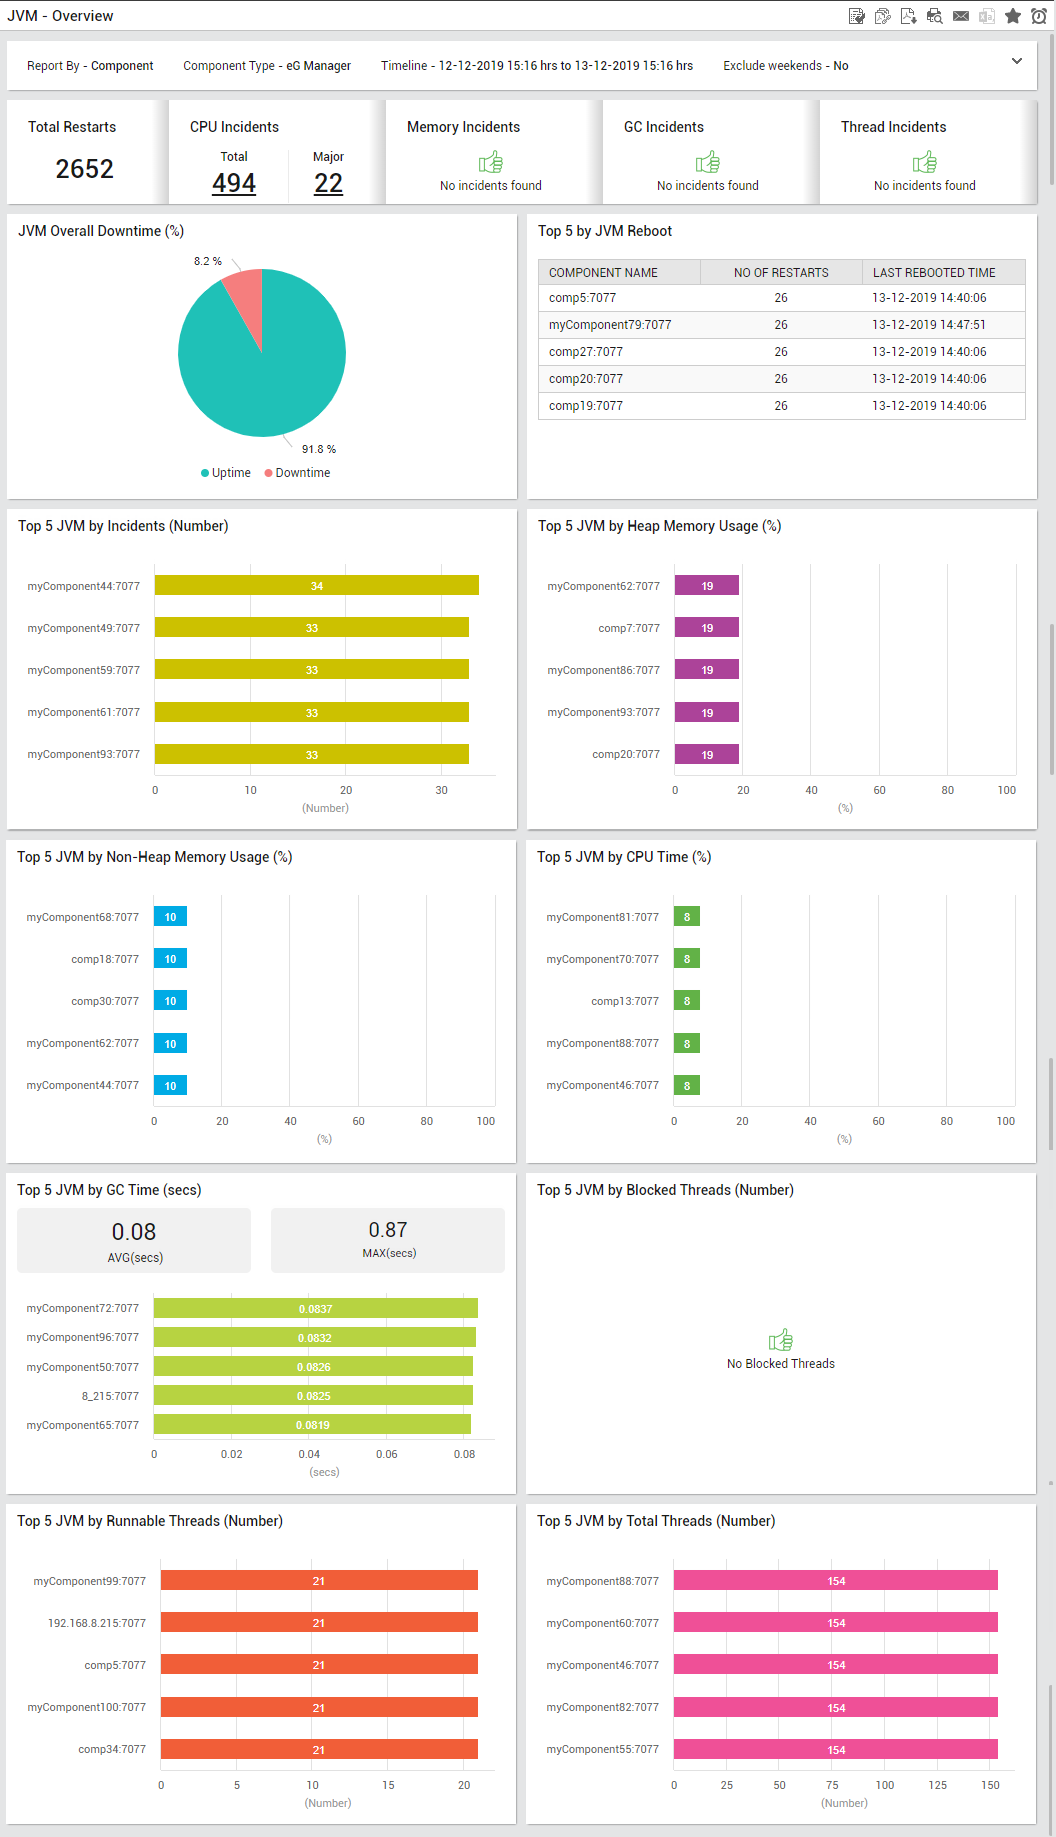
Figure 3 : The generated JVM - Overview report if the Report Type chosen is Overview
From Figure 3, you can figure out the following:
- The first section in the generated report displays the count of JVM restarts, CPU incidents, memory incidents, Garbage collection incidents and thread related incidents that occurred during the chosen time period. Using this section, administrators can instantly be alerted to the type of incident that had been frequently noticed, and can be alerted to initiate remedial measures. Clicking on the incidents will lead you to History of Alerts Report.
- The JVM Overall Downtime pie chart helps administrators determine if the JVM was up and running or if the JVM is down for the most of the chosen period. The Top 5 JVM Reboots section helps administrators figure out the component types that had frequently encountered JVM reboots.
- The next section offers a series of bar graphs. Using this section, administrators can identify the Top N JVMs that are impacted by blocked threads, runnable threads, garbage collection etc.
-
If the option chosen from the Report Generation list is Foreground Generation - HTML and if the Report Type is chosen as Detailed, then, clicking on the Run Report button will invoke Figure 4.
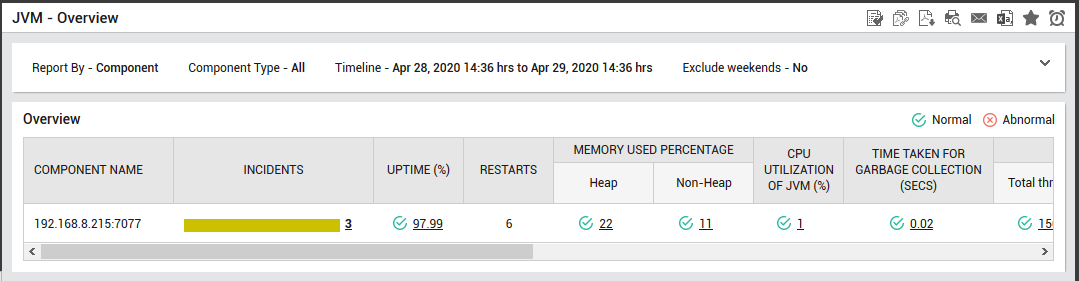
Figure 4 : The generated Overview report when the Report Type is chosen as Detailed
From the detailed report, administrators can figure out the uptime, JVM restarts, incidents that occurred, resource utilization etc for each component. Using this report, administrators can figure out the components that are more prone to incidents. Clicking on a value in the INCIDENTS column will lead you to the History of Alerts Report. Appropriate Color coding is used in this report so that administrators can easily identify the exact resource that is abnormal. Clicking on a value in the Uptime column will lead you to the JVM - Uptime / Downtime Analysis Report. Similarly, clicking on the values in other columns too will lead you to the appropriate reports.