GPU Adapter Details - OS Test
A graphics processing unit (GPU) adapter (also known as video card, graphics card, and video adapter) is a discreet card connected to one or more physical/virtual machines. The GPU adapter contains video RAM and a GPU chip and renders real-time 2D and 3D graphics applications, images, animations and video by performing rapid mathematical calculations. To perform such calculations at higher speed, the GPU adapter should be allocated with adequate memory on the virtual machine. Inadequate memory allocation and inefficient utilization of the GPU adapter can affect the processing of intensive tasks related graphics on the virtual machines, which in turn can adversely impact the performance of the applications operating on the VMs. Therefore, it is imperative that administrators should closely observe how well the GPU adapter uses the allocated and shared memory available to it. This way, a potential memory crunch can be proactively detected. This can be achieved with the help of the GPU Adapter Details - OS test.
The test auto-discovers the GPU adapters connected to each virtual machine on the virtual server and for each GPU adapter, reports the statistics related to memory utilization. This test also reveals how well the GPU is utilized for performing different tasks such as video decoding, processing 3D frames, etc. These metrics help administrators to judge whether/not adequate memory is available for use by the GPU adapters and identify the GPU adapter that is running out of memory.
Note:
This test will report metrics for NVIDIA GPUs only if the requirements detailed in
This test is disabled by default. To enable the test, go to the enable / disable tests page using the menu sequence : Agents -> Tests -> Enable/Disable, pick the desired Component type, set Performance as the Test type, choose the test from the disabled tests list, and click on the < button to move the test to the ENABLED TESTS list. Finally, click the Update button.
Target of the test : An ESX server host
Agent deploying the test : An internal/remote agent
Outputs of the test : One set of results for every combination of each virtual machine:GPU adapter on the virtual server.
| Parameter | Description |
|---|---|
|
Test Period |
How often should the test be executed |
|
Host |
The host for which the test is to be configured |
|
Port |
The port at which the specified HOST listens. By default, this is NULL. |
|
ESX User and ESX Password |
In order to enable the test to extract the desired metrics from a target ESX server, you need to configure the test with an ESX USER and ESX PASSWORD. The user credentials to be passed here depend upon the mechanism used by the eG agent for auto-discovering the VMs on the target vSphere server and monitoring the server and its VMs. These discovery/monitoring methodologies and their corresponding configuration requirements have been discussed hereunder:
|
|
Confirm Password |
Confirm the specified ESX PASSWORD by retyping it here. |
|
SSL |
By default, the ESX server is SSL-enabled. Accordingly, the SSL flag is set to Yes by default. This indicates that the eG agent will communicate with the ESX server via HTTPS by default. On the other hand, if the eG agent has been configured to use the VMPerl API or CLI for monitoring (i.e., if the ESX USER parameter is set to none), then the status of the SSL flag is irrelevant. Like the ESX sever, the vCenter is also SSL-enabled by default. If you have chosen to use the vCenter for monitoring all the ESX servers in your environment, then you have to set the SSL flag to Yes. |
|
Webport |
By default, in most virtualized environments, the ESX server and vCenter listen on port 80 (if not SSL-enabled) or on port 443 (if SSL-enabled). This implies that while monitoring an SSL-enabled ESX server directly, the eG agent, by default, connects to port 443 of the ESX server to pull out metrics, and while monitoring a non-SSL-enabled ESX server, the eG agent connects to port 80. Similarly, while monitoring an ESX server via an SSL-enabled vCenter, the eG agent connects to port 443 of vCenter to pull out the metrics, and while monitoring via a non-SSL-enabled vCenter, the eG agent connects to port 80 of vCenter. Accordingly, the WEBPORT parameter is set to 80 or 443 depending upon the status of the SSL flag. In some environments however, the default ports 80 or 443 might not apply. In such a case, against the WEBPORT parameter, you can specify the exact port at which the ESX server or vCenter in your environment listens so that the eG agent communicates with that port. |
|
Virtual Center |
If the eG manager had discovered the target ESX server by connecting to vCenter, then the IP address of the vCenter server used for discovering this ESX server would be automatically displayed against the VIRTUAL CENTER parameter; similarly, the ESX USER and ESX PASSWORD text boxes will be automatically populated with the vCenter user credentials, using which ESX discovery was performed. If this ESX server has not been discovered using vCenter, but you still want to discover the guests on the ESX server via vCenter, then select the IP address of the vCenter host that you wish to use for guest discovery from the VIRTUAL CENTER list. By default, this list is populated with the IP address of all vCenter hosts that were added to the eG Enterprise system at the time of discovery. Upon selection, the ESX USERand ESX PASSWORD that were pre-configured for that vCenter server will be automatically displayed against the respective text boxes. On the other hand, if the IP address of the vCenter server of interest to you is not available in the list, then, you can add the details of the vCenter server on-the-fly, by selecting the Other option from the VIRTUAL CENTER list. This will invoke the ADD VCENTER SERVER DETAILS page. Refer to Adding the Details of a vCenter Server for VM Discovery On the other hand, if you want the eG agent to behave in the default manner -i.e., communicate with each ESX server for monitoring and VM information - then set the VIRTUAL CENTER parameter to ‘none’. |
|
Exclude VMs |
Administrators of some virtualized environments may not want to monitor some of their less-critical VMs - for instance, VM templates - both from ‘outside’ and from ‘inside’. The eG agent in this case can be configured to completely exclude such VMs from its monitoring purview. To achieve this, provide a comma-separated list of VMs to be excluded from monitoring in the EXCLUDE VMS text box. Instead of VMs, VM name patterns can also be provided here in a comma-separated list. For example, your exclude vms specification can be: *xp,*lin*,win*,vista. Here, the * (asterisk) is used to denote leading and trailing spaces (as the case may be). By default, this parameter is set to none indicating that the eG agent obtains the inside and outside views of all VMs on a virtual host by default. By providing a comma-separated list of VMs/VM name patterns in the EXCLUDE VMS text box, you can make sure the eG agent stops collecting ‘inside’ and ‘outside’ view metrics for a configured set of VMs. |
|
Exclude IP |
Typically, when performing VM discovery, the eG agent automatically discovers the operating system on which every VM runs, and all the IP addresses that each VM supports. If two are more VMs on a target vSphere server are in a VM cluster, then the eG agent will also auto-discover the cluster IP address. Since the cluster IP address is shared by all VMs in the cluster, this IP address will be in the discovery list of every VM in the cluster. In this case, if the eG agent attempts to obtain the 'inside view' of each VM in a cluster using their cluster IP address, incorrect metrics may be reported sometimes. To avoid this, you may want to instruct the eG agent to not use the cluster IP address when collecting 'inside view' metrics. For this, specify a comma-separated list of cluster IP addresses to be excluded in the EXCLUDE IP text box. |
|
Ignore VMs Inside View |
Administrators of some high security VMware environments might not have permissions to internally monitor one/more VMs. The eG agent can be configured to not obtain the ‘inside view’ of such ‘inaccessible’ VMs using the IGNORE VMS INSIDE VIEW parameter. Against this parameter, you can provide a comma-separated list of VM names, or VM name patterns, for which the inside view need not be obtained. For instance, your IGNORE VMS INSIDE VIEW specification can be: *xp,*lin*,win*,vista. Here, the * (asterisk) is used to denote leading and trailing spaces (as the case may be). By default, this parameter is set to none indicating that the eG agent obtains the inside view of all VMs on an ESX host by default. Note: While performing VM discovery, the eG agent will not discover the operating system of the VMs configured in the IGNORE VMS INSIDE VIEW text box. |
|
Ignore WINNT |
By default, the eG agent does not support the inside view for VMs executing on Windows NT operating systems. Accordingly, the IGNORE WINNT flag is set to Yes by default. |
|
Inside view using |
By default, this test obtains the “inside view” of VMs using the eG VM Agent. Accordingly, the Inside view using flag is set to eG VM Agent by default. The eG VM Agent is a piece of software, which should be installed on every VM on a hypervisor. Every time the eG agent runs this test, it uses the eG VM Agent to pull relevant 'inside view' metrics from each VM. Once the metrics are collected, the eG agent then communicates with each VM agent and pulls these metrics, without requiring administrator privileges. Refer to Configuring the Remote Agent to Obtain the Inside View of VMs for more details on the eG VM Agent. |
|
Domain, Admin User, and Admin Password, and Confirm Password |
By default, these parameters are set to none. This is because, by default, the eG agent collects 'inside view' metrics using the eG VM agent on each VM. Domain administrator privileges need not be granted to the eG agent if it uses this default approach to obtain the 'inside view' of Windows VMs. |
|
Report By User |
This flag is set to Yes by default. The value of this flag cannot be changed. This implies that the virtual machines in VDI environments will always be identified using the login name of the user. In other words, in VDI environments, this test will, by default, report measures for every username_on_virtualmachinename. |
|
Report Powered OS |
This flag becomes relevant only if the REPORT BY USERflag is set to ‘Yes’ If the REPORT POWERED OS flag is set to Yes (which is the default setting), then this test will report measures for even those VMs that do not have any users logged in currently. Such guests will be identified by their virtualmachine name and not by the username_on_virtualmachinename. On the other hand, if the REPORT POWERED OS flag is set to No, then this test will not report measures for those VMs to which no users are logged in currently. |
|
Detailed Diagnosis |
To make diagnosis more efficient and accurate, eG Enterprise embeds an optional detailed diagnostic capability. With this capability, the eG agents can be configured to run detailed, more elaborate tests as and when specific problems are detected. To enable the detailed diagnosis capability of this test for a particular server, choose the On option. To disable the capability, click on the Off option. The option to selectively enable/disable the detailed diagnosis capability will be available only if the following conditions are fulfilled:
|
| Measurement | Description | Measurement Unit | Interpretation |
|---|---|---|---|
|
Available GPU memory |
Indicates the total amount of memory allocated for this GPU adapter on this VM. |
MB |
|
|
GPU memory used |
Indicates the amount of memory that is utilized by this GPU adapters. |
MB |
|
|
GPU memory free |
Indicates the amount of memory that is available for use by this GPU adapter. |
MB |
Ideally, the value of this measure should be high. A consistent decrease in the value of this measure is indicative of a steady erosion of memory available for GPU, which if left unattended, can significantly impact GPU functioning. |
|
GPU memory usage |
Indicates the percentage of memory that is utilized by this GPU adapter. |
Percent |
A low value is desired for this measure. If the value of this measure grows very close to 100%, it indicates that the GPU will soon run out of memory resources. Such an occurrence will not only impact the functioning of the GPU card, but also the applications depend on it. |
|
Total dedicated video memory |
Indicates the total amount of dedicated video memory allocated this GPU adapter. |
MB |
The dedicated video memory or Video RAM (or VRAM) is a special type of RAM that works with your computer's GPU card/adapter. The video RAM holds information that the GPU needs, including game textures and lighting effects. This allows the GPU to quickly access the info and output video to your monitor. |
|
Used dedicated video memory |
Indicates the amount of dedicated video memory that is utilized by this GPU adapter. |
MB |
Ideally, a low value is desired for this measure. A high value for this measure indicates that the dedicated video memory is depleting rapidly. When the dedicated video memory is filled up, the GPU will rely on standard RAM for processing video frames and display textures. This in turn will seriously impact overall performance of the RAM. |
|
Free dedicated video memory |
Indicates the amount of dedicated video memory that is available for use by this GPU adapter. |
MB |
A high value is desired for this measure. If the value of this measure is very low, it indicates that the GPU does not have adequate memory for processing video frames. |
|
Dedicated memory usage |
Indicates the percent of dedicated video memory that is utilized by this GPU adapter. |
Percent |
Use the detailed diagnosis of the this measure to find out the names of top-10 applications that are over-utilizing the dedicated memory. Administrators can also find out the percentage of dedicated memory utilized by each application, PID of each application and path to a folder where each application image is stored. |
|
Total system shared memory |
Indicates the total amount of system memory that can be utilized by this GPU adapter. |
MB |
Shared memory represents system memory that can be used by the GPU. Shared memory can be used by the CPU for processing normal system tasks needed or as “video memory” for the GPU while processing video tasks. |
|
Used system shared memory |
Indicates the amount of system memory that is utilized by this GPU adapter. |
MB |
Typically, shared memory will be used for GPU tasks only if the dedicated video memory (VRAM) runs out. A high value for this measure therefore implies that the GPU adapter is contenting for limited VRAM. Moreover, since shared memory is essentially RAM, excessive usage of shared memory can slow down the adapter. This is why, a low value is desired for this measure. |
|
Free system shared memory |
Indicates the amount of system memory that is available for use by this GPU adapter. |
MB |
The value of this measure should be high. |
|
System shared usage |
Indicates the percentage of system memory that is utilized by this GPU adapter. |
Percent |
Typically, shared memory will be used for GPU tasks only if the dedicated video memory (VRAM) runs out. A high value for this measure therefore implies that the GPU adapter is contenting for limited VRAM. Moreover, since shared memory is essentially RAM, excessive usage of shared memory can slow down the adapter. This is why, a low value is desired for this measure. Use the detailed diagnosis of the this measure to find out the names of top-10 applications that are over-utilizing the system shared memory. Administrators can also find out the percentage of dedicated memory utilized by each application, PID of each application and path to a folder where each application image is stored. |
|
System video memory |
Indicates the amount of system video memory that can be used by this GPU adapter. |
MB |
|
|
Total committed memory |
Indicates the total amount of committed memory allocated for this GPU adapter. |
MB |
Use the detailed diagnosis of the Total committed memory measure to find out the names of top-10 applications that are over-utilizing the GPU committed memory. Administrators can also find out the percentage of dedicated memory utilized by each application, PID of each application and path to a folder where each application image is stored. |
|
GPU utilization |
Indicates the percentage of this GPU adapter utilized in this VM. |
Percent |
A value close to 100% is a cause of concern which requires further investigation. Compare the value of this measure across the GPU adapters to know the GPU adapter that is being over-utilized. The detailed diagnosis of this measure lists the names of top-10 applications in descending order based on the percentage of overall GPU utilization. Administrators can also find out the PID of application and path to a folder where the application image is stored. |
|
3D utilization |
Indicates the percentage of this GPU adapter utilized for processing 3D frames. |
Percent |
Compare the value of this measure across the GPU adapters to identify the GPU adapter that is being over-utilized. The detailed diagnosis of this measure lists the names of top-10 applications in descending order based on the percentage of GPU utilized for processing 3D frames. Administrators can also find out the PID of application and path to a folder where the application image is stored. |
|
Video decode utilization |
Indicates the percentage of this GPU adapter utilized for performing video decoding process. |
Percent |
The detailed diagnosis of this measure lists the names of top-10 applications in descending order based on the percentage of GPU utilized for video decoding process. Administrators can also find out the PID of application and path to a folder where the application image is stored. |
|
Copy utilization |
Indicates the percentage of this GPU adapter utilized for copying operations. |
Percent |
The detailed diagnosis of this measure lists the names of top-10 applications in descending order based on the percentage of GPU utilized for copying operations. Administrators can also find out the PID of application and path to a folder where the application image is stored. |
|
Video processing utilization |
Indicates the percentage of this GPU adapter utilized for processing video frames. |
Percent |
Compare the value of this measure across the GPU adapters to figure out which GPU adapter is over-utilized for processing video frames. |
The detailed diagnosis of the GPU utilization measure lists the names of top-10 applications in descending order based on the percentage of overall GPU utilization. Administrators can also find out the PID of application and path to a folder where the application image is stored.
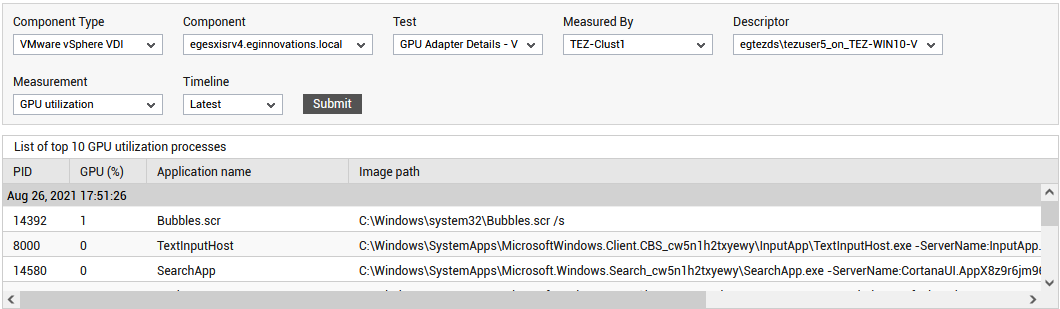
Figure 1 : The detailed diagnosis of the GPU utilization measure
The detailed diagnosis of the 3D utilization measure lists the names of top-10 applications in descending order based on the percentage of GPU utilized for processing the 3D frames. Administrators can also find out the PID of application and path to a folder where the application image is stored.
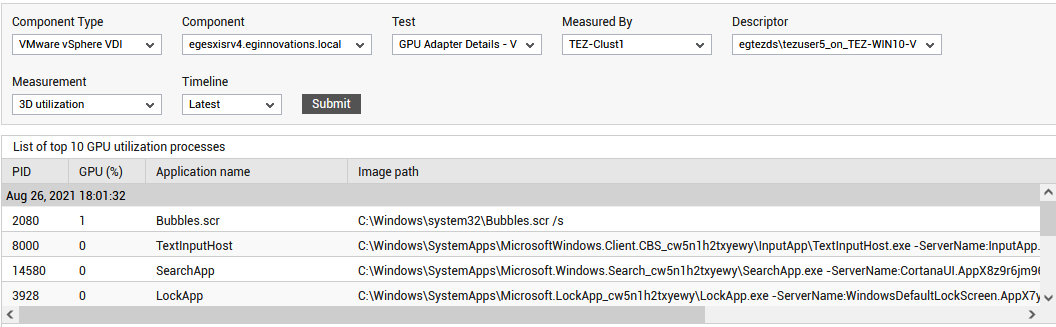
Figure 2 : The detailed diagnosis of the 3D utilization measure
The detailed diagnosis of the Video decode utilization measure lists the names of top-10 applications in descending order based on the percentage of overall GPU utilized for video decoding process. Administrators can also find out the PID of application and path to a folder where the application image is stored.
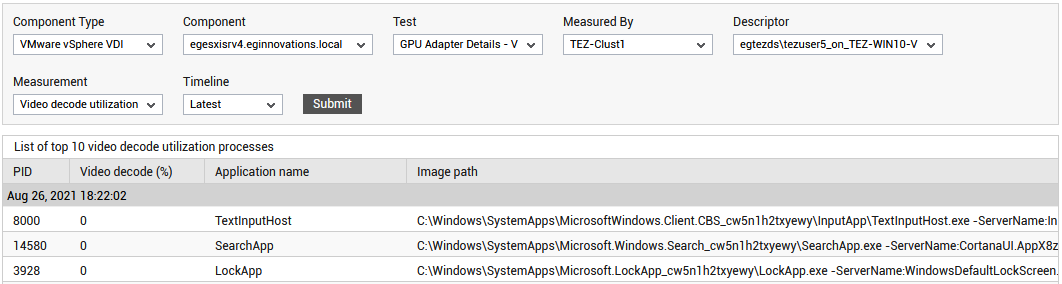
Figure 3 : The detailed diagnosis of the Video decode utilization measure
The detailed diagnosis of the Copying utilization measure lists the names of top-10 applications in descending order based on the percentage of overall GPU utilized for copying operations. Administrators can also find out the PID of application and path to a folder where the application image is stored.
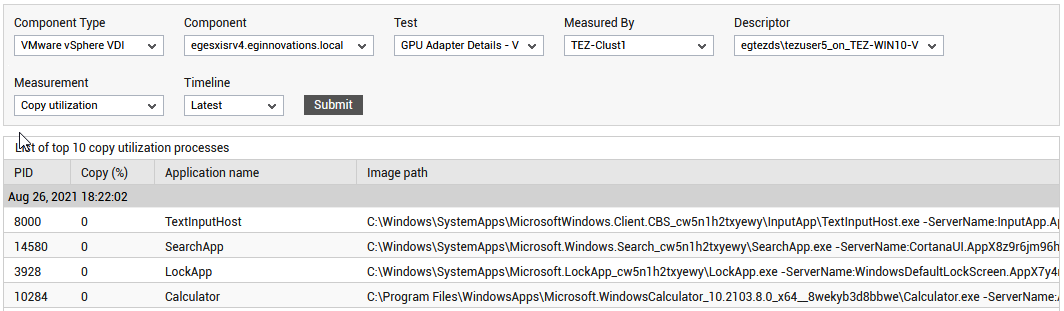
Figure 4 : The detailed diagnosis of the Copying utilization measure
Use the detailed diagnosis of the Dedicated memory usage measure to find out the names of top-10 applications that are over-utilizing the dedicated memory. Administrators can also find out the percentage of dedicated memory utilized by each application, PID of each application and path to a folder where each application image is stored.
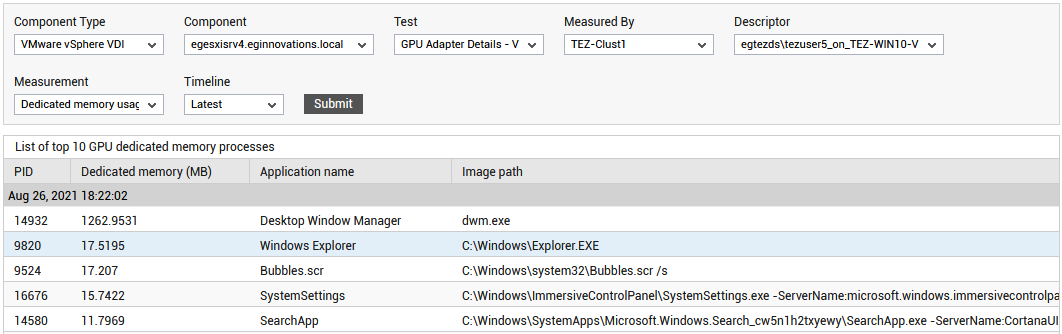
Figure 5 : The detailed diagnosis of the Dedicated memory usage measure
Use the detailed diagnosis of the System shared usage measure to find out the names of top-10 applications that are over-utilizing the system shared memory. Administrators can also find out the percentage of dedicated memory utilized by each application, PID of each application and path to a folder where each application image is stored.
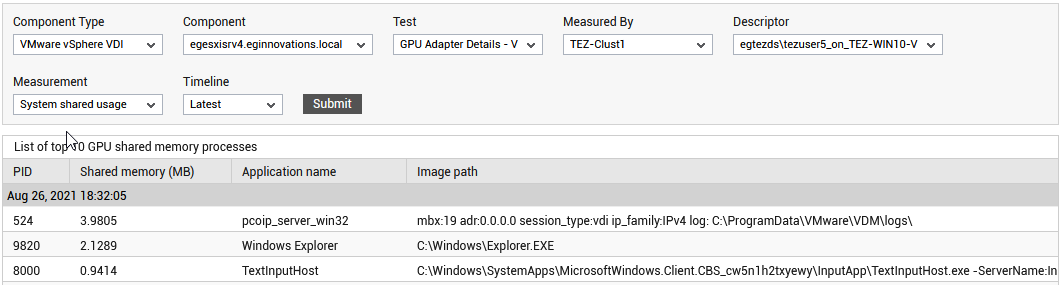
Figure 6 : The detailed diagnosis of the System shared usage measure
Use the detailed diagnosis of the Total committed memory measure to find out the names of top-10 applications that are over-utilizing the GPU committed memory. Administrators can also find out the percentage of dedicated memory utilized by each application, PID of each application and path to a folder where each application image is stored.
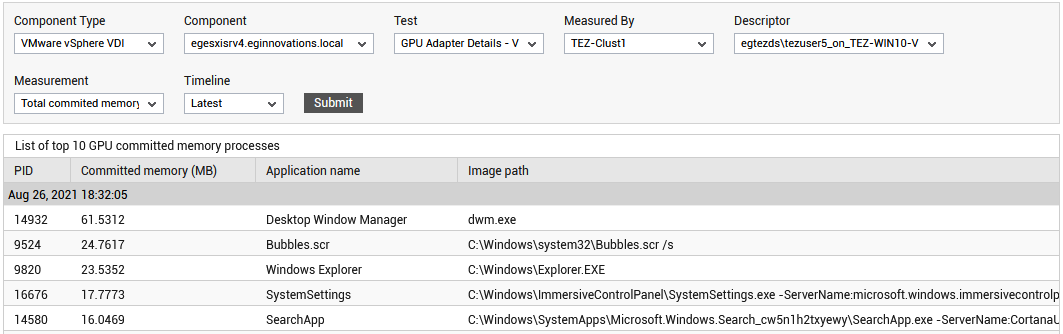
Figure 7 : The detailed diagnosis of the Total committed memory measure