Network - ESX Test
This test reports key statistics pertaining to the network traffic to and from every network interface supported by the ESX server host.
Target of the test : An ESX server host
Agent deploying the test : An internal/remote agent
Outputs of the test : One set of results for every network interface supported by the ESX server host monitored
| Parameter | Description |
|---|---|
|
Test Period |
How often should the test be executed |
|
Host |
The host for which the test is to be configured |
|
Port |
The port at which the specified HOST listens. By default, this is NULL. |
|
ESX User and ESX Password |
In order to enable the test to extract the desired metrics from a target ESX server, you need to configure the test with an ESX USER and ESX PASSWORD. The user credentials to be passed here depend upon the mechanism used by the eG agent for auto-discovering the VMs on the target vSphere server and monitoring the server and its VMs. These discovery/monitoring methodologies and their corresponding configuration requirements have been discussed hereunder:
|
|
Confirm Password |
Confirm the specified ESX PASSWORD by retyping it here. |
|
SSL |
By default, the ESX server is SSL-enabled. Accordingly, the SSL flag is set to Yes by default. This indicates that the eG agent will communicate with the ESX server via HTTPS by default. On the other hand, if the eG agent has been configured to use the VMPerl API or CLI for monitoring (i.e., if the ESX USER parameter is set to none), then the status of the SSL flag is irrelevant. Like the ESX sever, the vCenter is also SSL-enabled by default. If you have chosen to use the vCenter for monitoring all the ESX servers in your environment, then you have to set the SSL flag to Yes. |
|
Webport |
By default, in most virtualized environments, the ESX server and vCenter listen on port 80 (if not SSL-enabled) or on port 443 (if SSL-enabled). This implies that while monitoring an SSL-enabled ESX server directly, the eG agent, by default, connects to port 443 of the ESX server to pull out metrics, and while monitoring a non-SSL-enabled ESX server, the eG agent connects to port 80. Similarly, while monitoring an ESX server via an SSL-enabled vCenter, the eG agent connects to port 443 of vCenter to pull out the metrics, and while monitoring via a non-SSL-enabled vCenter, the eG agent connects to port 80 of vCenter. Accordingly, the WEBPORT parameter is set to 80 or 443 depending upon the status of the SSL flag. In some environments however, the default ports 80 or 443 might not apply. In such a case, against the WEBPORT parameter, you can specify the exact port at which the ESX server or vCenter in your environment listens so that the eG agent communicates with that port. |
|
Virtual Center |
If the eG manager had discovered the target ESX server by connecting to vCenter, then the IP address of the vCenter server used for discovering this ESX server would be automatically displayed against the VIRTUAL CENTER parameter; similarly, the ESX USER and ESX PASSWORD text boxes will be automatically populated with the vCenter user credentials, using which ESX discovery was performed. If this ESX server has not been discovered using vCenter, but you still want to discover the guests on the ESX server via vCenter, then select the IP address of the vCenter host that you wish to use for guest discovery from the VIRTUAL CENTER list. By default, this list is populated with the IP address of all vCenter hosts that were added to the eG Enterprise system at the time of discovery. Upon selection, the ESX USERand ESX PASSWORD that were pre-configured for that vCenter server will be automatically displayed against the respective text boxes. On the other hand, if the IP address of the vCenter server of interest to you is not available in the list, then, you can add the details of the vCenter server on-the-fly, by selecting the Other option from the VIRTUAL CENTER list. This will invoke the ADD VCENTER SERVER DETAILS page. Refer to Adding the Details of a vCenter Server for VM Discovery On the other hand, if you want the eG agent to behave in the default manner -i.e., communicate with each ESX server for monitoring and VM information - then set the VIRTUAL CENTER parameter to ‘none’. |
|
Report Active Only |
By default, this test reports metrics for only those network interfaces that are connected to a vSwitch. Accordingly, the REPORT ACTIVE ONLY flag is set to Yes by default. To ensure that the test reports metrics for all network interfaces, regardless of whether/not they are connected to a vSwitch, set this flag to No. |
|
Detailed Diagnosis |
To make diagnosis more efficient and accurate, eG Enterprise embeds an optional detailed diagnostic capability. With this capability, the eG agents can be configured to run detailed, more elaborate tests as and when specific problems are detected. To enable the detailed diagnosis capability of this test for a particular server, choose the On option. To disable the capability, click on the Off option. The option to selectively enable/disable the detailed diagnosis capability will be available only if the following conditions are fulfilled:
|
|
Measurement |
Description |
Measurement Unit |
Interpretation |
||||||
|---|---|---|---|---|---|---|---|---|---|
|
Network packets transmitted: |
Indicates the rate at which packets were transmitted by this network interface. |
Packets/Sec |
An increase in traffic from the server can indicate an increase in accesses from the server (from users on the ESX server, or from the virtual machines on the server). Use the detailed diagnosis of the Network packets transmitted measure to know the rate at which packets were transmitted by each VM on the target virtual host via this NIC. Likewise, you can use the detailed diagnosis of the Network data transmitted measure to know how much data was transmitted per second by every VM on this hypervisor via this NIC. From these detailed metrics, you can precisely pinpoint the VM that is imposing the maximum load on this NIC. |
||||||
|
Network data transmitted: |
Indicates the rate at which data was transmitted by this network interface. |
Mbps |
|||||||
|
Network packets received: |
Indicates the rate at which data packets were received by this network interface. |
Packets/Sec |
An increase in traffic to the server can indicate an increase in accesses to the server (from users or from other applications external to the server) or that the server is under an attack of some form. Use the detailed diagnosis of the Network packets received measure to know the rate at which packets were received by each VM on the target virtual host via this NIC. Likewise, you can use the detailed diagnosis of the Network data received measure to know how much data was received per second by every VM on this hypervisor via this NIC. From these detailed metrics, you can precisely pinpoint the VM that is imposing the maximum load on this NIC. |
||||||
|
Network data received: |
Indicates the rate at which data was received by this network interface. |
Mbps |
|||||||
|
Status: |
Indicates whether the network interface card is available or not. |
|
If this measure reports the value Up, it indicates that the NIC is accessible. Whereas, if the status is Down, it indicates that the NIC cannot be accessed. The numeric values that correspond to each of the states discussed above are listed in the table below:
Note: By default, this measure reports the value Up or Down to indicate the availability of the NIC. The graph of this measure however, represents the status of an NIC using the numeric equivalents - 100 or 0. |
||||||
|
Speed: |
Indicates the current speed of this network interface card. |
Mbps |
Compare the value of this measure across NICs to identify the slowest NIC and to assess network usage across NICs. You can also use the value of this measure to predict the maximum throughput that can be reached. |
||||||
|
Packets dropped during transmission: |
Indicates the rate at which packet were dropped by this interface during transmissions. |
Packets/Sec |
A low value is typically desired for this measure. |
||||||
|
During transmission dropped packets: |
Indicates the percentage of packets that were dropped by this network interface during transmissions. |
Percent |
A very high value of this measure is a cause for concern, as it could indicate a network congestion. |
||||||
|
Packets dropped during reception: |
Indicates the rate at which packets were dropped by this interface during reception. |
Packets/Sec |
A low value is typically desired for this measure. |
||||||
|
During reception dropped packets: |
Indicates the percentage of packets that were dropped by this network interface during reception. |
Percent |
A very high value of this measure is a cause for concern, as it could indicate a network congestion. |
||||||
|
Network IOPS: |
Indicates the rate at which packets were received and transmitted by this network interface. |
Packets/Sec |
A high value is desired for this measure. A consistent drop in the value of this measure is a cause for concern, as it indicates a strain on the network interface, which is causing it to slowdown. |
||||||
|
Network throughput: |
Indicates the rate at which data was received and transmitted by this network interface |
MB/Sec |
A high value is desired for this measure. A consistent drop in the value of this measure is a cause for concern, as it indicates a strain on the network interface, which is causing it to slowdown. |
||||||
|
Unknown protocol frames received |
Indicates the rate at which packets with unknown protocol were received by this network interface. |
Packets/Sec |
For packet-oriented interfaces, this measure will report the number of packets received via the interface which were discarded because of an unknown or unsupported protocol. For character-oriented or fixed-length interfaces that support protocol multiplexing, this measure reports the number of transmission units received via the interface which were discarded because of an unknown or unsupported protocol. For any interface that does not support protocol multiplexing, this counter will always be 0. |
||||||
|
Multicast packets received |
Indicates the rate at which multicast packets were received by this interface. |
Packets/Sec |
Multicast is the term used to describe communication where a piece of information is sent from one or more points to a set of other points. In this case there is may be one or more senders, and the information is distributed to a set of receivers (theer may be no receivers, or any other number of receivers). Multicasting is the networking technique of delivering the same packet simultaneously to a group of client. |
||||||
|
Multicast packets transmitted |
Indicates the rate at which multicast packets were transmitted by this interface. |
Packets/Sec |
|||||||
|
Broadcast packets received |
Indicates the rate at which broadcast packets were received by this interface. |
Packets/Sec |
Broadcast is the term used to describe communication where a piece of information is sent from one point to all other points. In this case there is just one sender, but the information is sent to all connected receivers. Broadcast transmission is supported on most LANs (e.g. Ethernet), and may be used to send the same message to all computers on the LAN (e.g. the address resolution protocol (arp) uses this to send an address resolution query to all computers on a LAN). Network layer protocols (such as IPv4) also support a form of broadcast that allows the same packet to be sent to every system in a logical network (in IPv4 this consists of the IP network ID and an all 1's host number). |
||||||
|
Broadcast packets transmitted |
Indicates the rate at which broadcast packets were sent by this interface. |
Packets/Sec |
|||||||
|
Packets received with errors |
Indicates the rate at which packets with errors were received by this interface. |
Packets/Sec |
Ideally, the value of these measures should be 0. |
||||||
|
Packets transmitted with errors |
Indicates the rate at which packets with errors were transmitted by this interface. |
Packets/Sec |
To know the network health across all network interfaces supported by the ESX server, just click on the descriptor with the name of the vSphere/ESXi server being monitored. For instance, in the case of Figure 1, click on the descriptor esx3i.chn.egurkha.com to view the following measure:
| Measurement | Description | Measurement Unit | Interpretation |
|---|---|---|---|
|
Network usage: |
Indicates the rate at which data transmitted and received for all the NIC instances of the host. |
Mbps |
Use the detailed diagnosis of this measure to know the data usage per VM on the monitored hypervisor. From this, you can quickly identify the VM that is making maximum use of the network resources of the vSphere/ESX server. |
Use the detailed diagnosis of the Network packets transmitted measure to know the rate at which packets were transmitted by each VM on the target virtual host via this NIC. This way, you can quickly identify the VM that is transmitting the maximum number of packets.
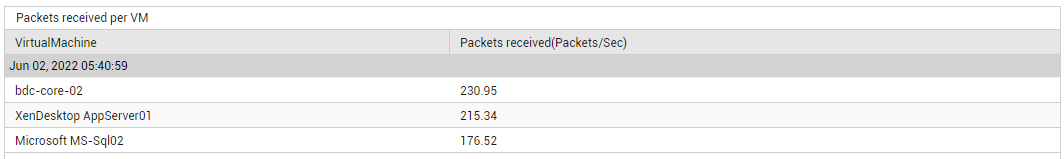
Figure 1 : The detailed diagnosis of the Network packets transmitted measure
You can use the detailed diagnosis of the Network data transmitted measure to know how much data was transmitted per second by every VM on this hypervisor via this NIC. This way, you can quickly identify the VM that is transmitting the most data.
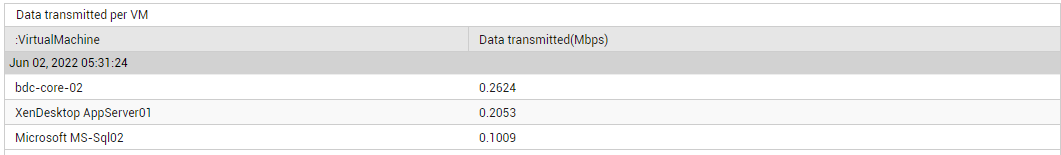
Figure 2 : The detailed diagnosis of the Network data transmitted measure
Use the detailed diagnosis of the Network packets received measure to know the rate at which packets were received by each VM on the target virtual host via this NIC. This will point you to the VM that is receiving the maximum number of packets.
Figure 3 : The detailed diagnosis of the Network packets received measure
You can use the detailed diagnosis of the Network data received measure to know how much data was received per second by every VM on this hypervisor via this NIC. This will point you to the VM that is receiving the most data.
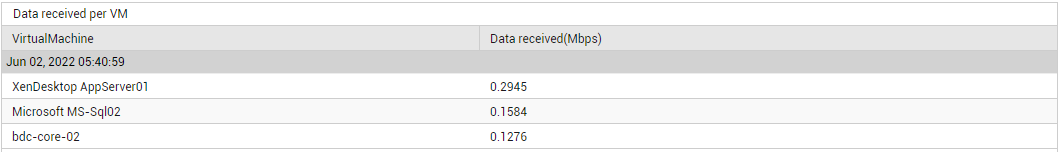
Figure 4 : The detailed diagnosis of the Network data received measure