System - Console Test
The CPU - ESX Test reports the CPU usage of each of the core components of an ESX server. When executed on an ESX server 3/3.5/4.0, this test reports the CPU usage of the service console component as well. However, if one/more processes executing on the console contend for limited CPU resources, the knowledge of the overall CPU usage of the console might alone not suffice; to troubleshoot better, administrators may additionally require the names of those processes that are currently executing on the console and the CPU usage of each. Similarly, while the Memory – ESX Test can alert administrators to a memory contention at the console-level (if an ESX sever 3/3.5/4.0 is monitored), it cannot provide pointers to which processes on the console are contributing to the abnormal memory consumption.
Therefore, to help administrators of ESX 3/3.5/4.0 servers to accurately diagnose the root-cause of CPU or memory contentions experienced by the service console, and to facilitate effective analysis of its impact on other parameters such as run queue length and swap memory usage, eG Enterprise offers the specialized System - Console test.
Target of the test : An ESX server 3/3.5/4.0
Agent deploying the test : An internal/remote agent
Outputs of the test : One set of results for the ESX server being monitored
| Parameter | Description |
|---|---|
|
Test Period |
How often should the test be executed |
|
Host |
The host for which the test is to be configured |
|
Console User |
|
|
Console Password |
Specify the password of the CONSOLE USERhere. |
|
Confirm Password |
Confirm the CONSOLE PASSWORDby retyping it here. |
|
Detailed Diagnosis |
To make diagnosis more efficient and accurate, eG Enterprise embeds an optional detailed diagnostic capability. With this capability, the eG agents can be configured to run detailed, more elaborate tests as and when specific problems are detected. To enable the detailed diagnosis capability of this test for a particular server, choose the On option. To disable the capability, click on the Off option. The option to selectively enable/disable the detailed diagnosis capability will be available only if the following conditions are fulfilled:
|
| Measurement | Description | Measurement Unit | Interpretation |
|---|---|---|---|
|
Virtual CPU utilization of console: |
This measurement indicates the percentage of utilization of the CPU time of the service console. |
Percent |
A high value could signify a CPU bottleneck. The CPU utilization may be high because a few processes are consuming a lot of CPU, or because there are too many processes contending for a limited resource. Check the currently running processes to see the exact cause of the problem. The detailed diagnosis of this test reveals the top-10 CPU-intensive processes on the console. |
|
System usage of CPU by console: |
Indicates the percentage of CPU time spent for system-level processing. |
Percent |
An unusually high value indicates a problem and may be due to too many system-level tasks executing simultaneously. |
|
Run queue length of console: |
Indicates the instantaneous length of the queue in which threads are waiting for the processor cycle. This length does not include the threads that are currently being executed. |
Number |
A value consistently greater than 2 indicates that many processes could be simultaneously contending for the processor. |
|
Blocked processes on console: |
Indicates the number of processes blocked for I/O, paging, etc. |
Number |
A high value could indicate an I/O problem on the console (e.g., a slow disk). |
|
Swap memory of console: |
Denotes the committed amount of virtual memory. This corresponds to the space reserved for virtual memory on disk paging file(s). |
MB |
An unusually high value for the swap usage can indicate a memory bottleneck. Check the memory utilization of individual processes to figure out the process(es) that has (have) maximum memory consumption and look to tune their memory usages and allocations accordingly. |
|
Free memory of console OS: |
Indicates the free memory available. |
MB |
A very low value of free memory is also an indication of high memory utilization on a host. The detailed diagnosis of this measure lists the top 10 processes responsible for maximum memory consumption on the service console. |
The detailed diagnosis of the Virtual CPU utilization of console measure reveals the top-10 CPU-intensive processes on the console.
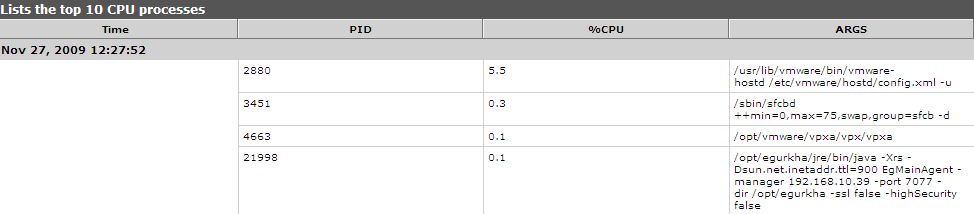
Figure 1 : The detailed diagnosis of the Virtual CPU utilization of console measure
The detailed diagnosis of the Free memory of console OS measure lists the top 10 processes responsible for maximum memory consumption on the service console.
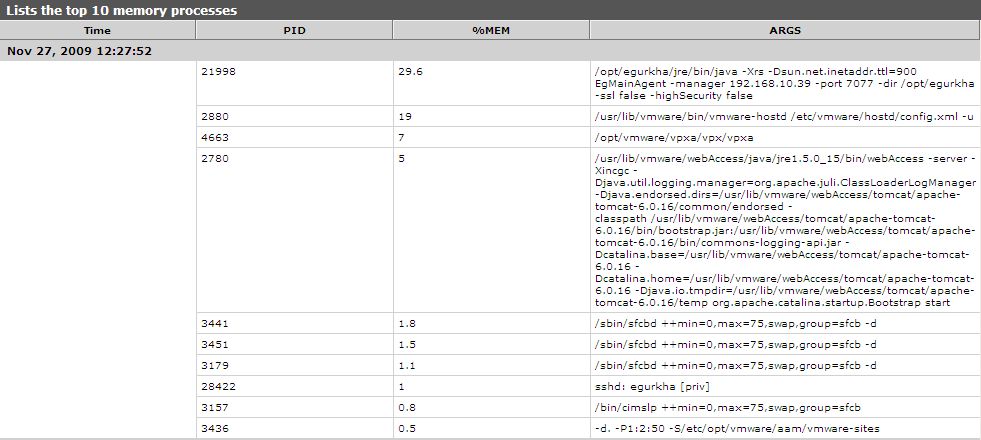
Figure 2 : The detailed diagnosis of the Free memory of console OS measure