Virtual Switches Test
The Virtual Switch is nothing more than a logical switching fabric built into your VMware infrastructure (ESX) so that you can network your VMs however you need them. While each virtual network (network of VMs) on an ESX server will be connecting to a single vSwitch only, a vSwitch may provide network support to more than one virtual network on an ESX server.
This test monitors the virtual networks connecting to each vSwitch on an ESX server, and reports the number of VMs, port groups, and physical adapters associated with these virtual networks. In addition, the test also reveals those adapters that are currently switched off.
Target of the test : An ESX server host
Agent deploying the test : An internal/remote agent
Outputs of the test : One set of results for each virtual switch that services the virtual networks on the ESX server being monitored
| Parameter | Description |
|---|---|
|
Test Period |
How often should the test be executed |
|
Host |
The host for which the test is to be configured |
|
Port |
The port at which the specified HOST listens. By default, this is NULL. |
|
ESX User and ESX Password |
In order to enable the test to extract the desired metrics from a target ESX server, you need to configure the test with an ESX USER and ESX PASSWORD. The user credentials to be passed here depend upon the mechanism used by the eG agent for auto-discovering the VMs on the target vSphere server and monitoring the server and its VMs. These discovery/monitoring methodologies and their corresponding configuration requirements have been discussed hereunder:
|
|
Confirm Password |
Confirm the specified ESX PASSWORD by retyping it here. |
|
SSL |
By default, the ESX server is SSL-enabled. Accordingly, the SSL flag is set to Yes by default. This indicates that the eG agent will communicate with the ESX server via HTTPS by default. On the other hand, if the eG agent has been configured to use the VMPerl API or CLI for monitoring (i.e., if the ESX USER parameter is set to none), then the status of the SSL flag is irrelevant. Like the ESX sever, the vCenter is also SSL-enabled by default. If you have chosen to use the vCenter for monitoring all the ESX servers in your environment, then you have to set the SSL flag to Yes. |
|
Webport |
By default, in most virtualized environments, the ESX server and vCenter listen on port 80 (if not SSL-enabled) or on port 443 (if SSL-enabled). This implies that while monitoring an SSL-enabled ESX server directly, the eG agent, by default, connects to port 443 of the ESX server to pull out metrics, and while monitoring a non-SSL-enabled ESX server, the eG agent connects to port 80. Similarly, while monitoring an ESX server via an SSL-enabled vCenter, the eG agent connects to port 443 of vCenter to pull out the metrics, and while monitoring via a non-SSL-enabled vCenter, the eG agent connects to port 80 of vCenter. Accordingly, the WEBPORT parameter is set to 80 or 443 depending upon the status of the SSL flag. In some environments however, the default ports 80 or 443 might not apply. In such a case, against the WEBPORT parameter, you can specify the exact port at which the ESX server or vCenter in your environment listens so that the eG agent communicates with that port. |
|
Virtual Center |
If the eG manager had discovered the target ESX server by connecting to vCenter, then the IP address of the vCenter server used for discovering this ESX server would be automatically displayed against the VIRTUAL CENTER parameter; similarly, the ESX USER and ESX PASSWORD text boxes will be automatically populated with the vCenter user credentials, using which ESX discovery was performed. If this ESX server has not been discovered using vCenter, but you still want to discover the guests on the ESX server via vCenter, then select the IP address of the vCenter host that you wish to use for guest discovery from the VIRTUAL CENTER list. By default, this list is populated with the IP address of all vCenter hosts that were added to the eG Enterprise system at the time of discovery. Upon selection, the ESX USERand ESX PASSWORD that were pre-configured for that vCenter server will be automatically displayed against the respective text boxes. On the other hand, if the IP address of the vCenter server of interest to you is not available in the list, then, you can add the details of the vCenter server on-the-fly, by selecting the Other option from the VIRTUAL CENTER list. This will invoke the ADD VCENTER SERVER DETAILS page. Refer to Adding the Details of a vCenter Server for VM Discovery On the other hand, if you want the eG agent to behave in the default manner -i.e., communicate with each ESX server for monitoring and VM information - then set the VIRTUAL CENTER parameter to ‘none’. |
|
DD Frequency |
Refers to the frequency with which detailed diagnosis measures are to be generated for this test. The default is 4:1. This indicates that, by default, detailed measures will be generated every fourth time this test runs, and also every time the test detects a problem. You can modify this frequency, if you so desire. Also, if you intend to disable the detailed diagnosis capability for this test, you can do so by specifying none against DD FREQUENCY. |
|
Detailed Diagnosis |
To make diagnosis more efficient and accurate, eG Enterprise embeds an optional detailed diagnostic capability. With this capability, the eG agents can be configured to run detailed, more elaborate tests as and when specific problems are detected. To enable the detailed diagnosis capability of this test for a particular server, choose the On option. To disable the capability, click on the Off option. The option to selectively enable/disable the detailed diagnosis capability will be available only if the following conditions are fulfilled:
|
Measurements made by the test
| Measurement | Description | Measurement Unit | Interpretation |
|---|---|---|---|
|
Port groups in vSwitch: |
Indicates the number of port groups associated with this vSwitch. |
Number |
Use the detailed diagnosis of this measure to determine the names of the port groups connecting to this vSwitch. |
|
VMs in vSwitch: |
Indicates the total number of VMs connected to this vSwitch. |
Number |
The detailed diagnosis of this measure reveals the names of the VMs serviced by the vSwitch and the port groups with which each VM is associated. |
|
Physical NICs in vSwitch: |
Indicates the number of physical network adapters associated with this vSwitch. |
Number |
A virtual network can be connected to a physical network by associating one or more physical Ethernet adapters, also referred to as uplink adapters, with the virtual network’s virtual switch. If no uplink adapters are associated with the virtual switch, all traffic on the virtual network is confined within the physical host machine. If one or more uplink adapters are associated with the virtual switch, virtual machines connected to that virtual network are also able to access the physical networks connected to the uplink adapters. To know which adapters are linked with this vSwitch, use the detailed diagnosis of this measure. |
|
Physical NICs in vSwitch that are up: |
Indicates the number of physical network adapters that are up. |
Number |
Use the detailed diagnosis of this measure to figure out which physical adapters are up. |
|
Physical NICs in vSwitch that are down: |
Indicates the number of physical network adapters that are down. |
Number |
Use the detailed diagnosis of this measure to figure out which physical adapters are down. |
|
Allocated NICs down: |
Indicates the percentage of physical network adapters that are down. |
Percent |
|
Use the detailed diagnosis of the Port groups in vSwitch measure to determine the names of the port groups connecting to a particular vSwitch.
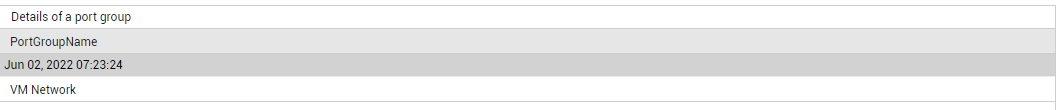
Figure 1 : The detailed diagnosis of the Port groups in vSwitch measure
The detailed diagnosis of the VMs in vSwitch measure reveals the names of the VMs serviced by the vSwitch and the port groups with which each VM is associated.
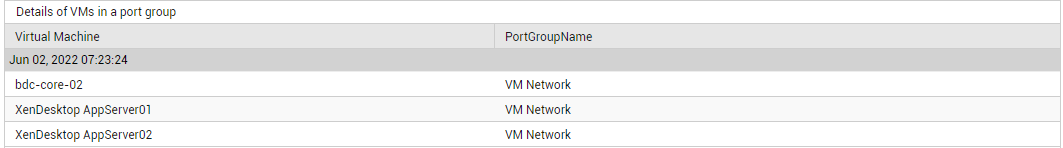
Figure 2 : The detailed diagnosis of the Virtual Machine in vSwitch measure
The detailed diagnosis of the Physical NICs in vSwitch measure displays the names of the physical adapters associated with a particular vSwitch.
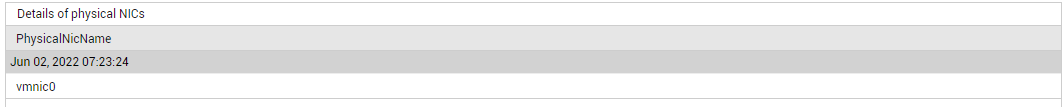
Figure 3 : The detailed diagnosis of the Physical NICs in vSwitch measure
Use the detailed diagnosis of the Physical NICs in vSwitch that are up measure to figure out which physical adapters are up.
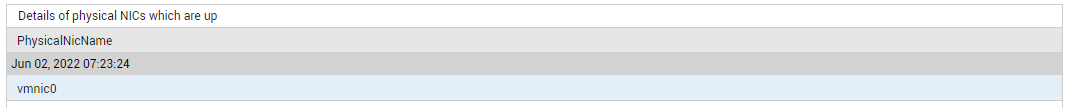
Figure 4 : The detailed diagnosis of the Physicals NICs in vSwitch that are up measure