Monitoring Windows 365 Cloud PCs
eG Enterprise provides a specialized, out-of-the-box Windows 365 Cloud PCs Group model designed specifically for monitoring the performance, configuration, and usage of physical desktops grouped together. This model consolidates key metrics across all desktops in the group, offering a unified view of their current state. Using these insights, administrators can quickly and accurately answer critical operational questions such as:
-
Which users are logged on and when did each user login?
-
How much CPU, memory, GPU, and network resources is each cloud PC taking?
-
What is the typical duration of a user session?
-
Who has the peak usage times?
-
What applications are running on each cloud PC? Which applications are the top CPU/memory consumers on the PC?
-
Did any application take too long to launch on the cloud PC?
-
Did any browser excessively consume the CPU/memory resources?
-
Is any device not installed with the latest Office security update?
-
Is any device failing to keep hardware interrupt CPU usage within normal limits?
To access these metrics, do the following:
-
Login to the eG monitoring console.
-
Close the Current Alarms / Unknowns window that pops up to focus on the Monitor Dashboard.
-
In the Components At-A-Glance section of the Monitor Dashboard, locate the bar graph representing the number of Windows 365 Cloud PCs Group components that are being monitored and their current state.
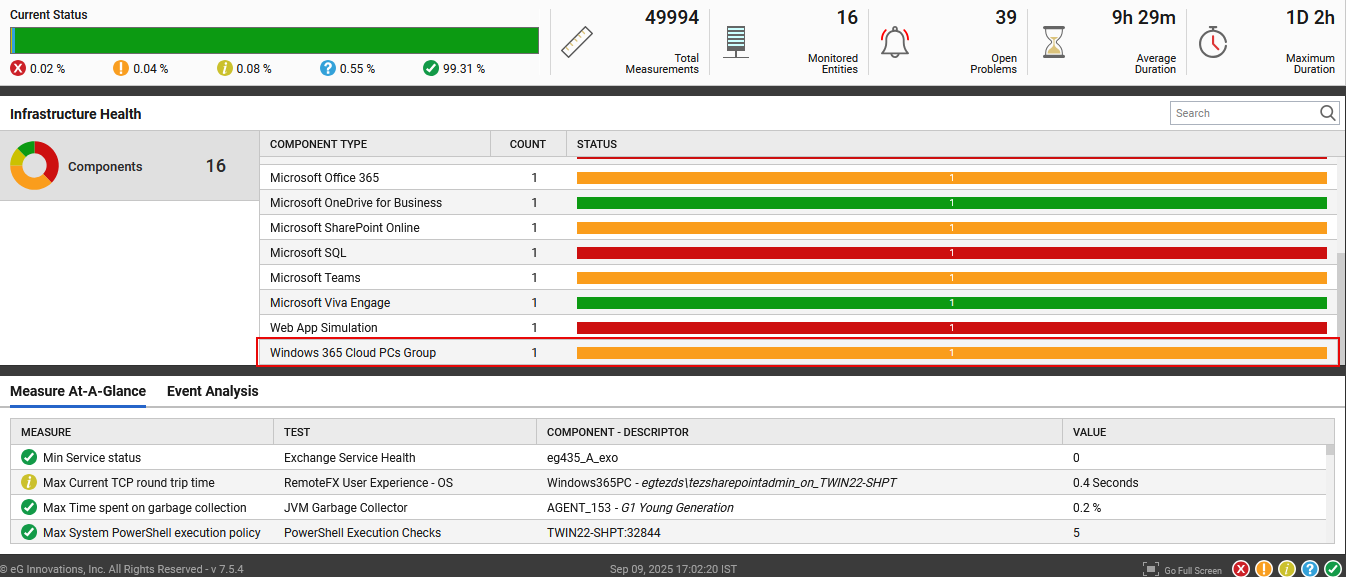
Figure 1 : The Monitor Dashboard
-
Click on a division (denoting a state) in the bar to know which Windows 365 Cloud PCs Group components are in that particular state. If only one Windows 365 Cloud PCs Group is managed, then the bar will represent the current state of that Windows 365 Cloud PCs Group alone. In this case, clicking on the bar will open Figure 2, displaying the Windows 365 Cloud PCs in the group that you clicked on, and the health of each cloud PC.
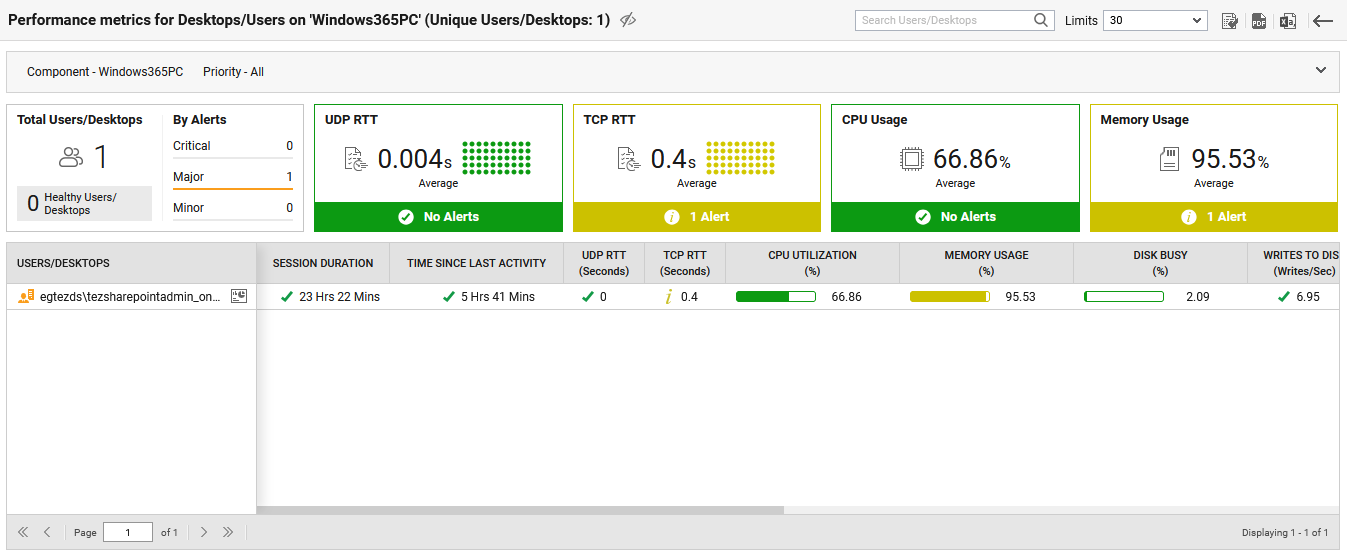
Figure 2 : The cloud PCs in a Windows 365 Cloud PCs group and the health of each cloud PC
-
Click on a cloud PC in Figure 2 to zoom into its performance.
-
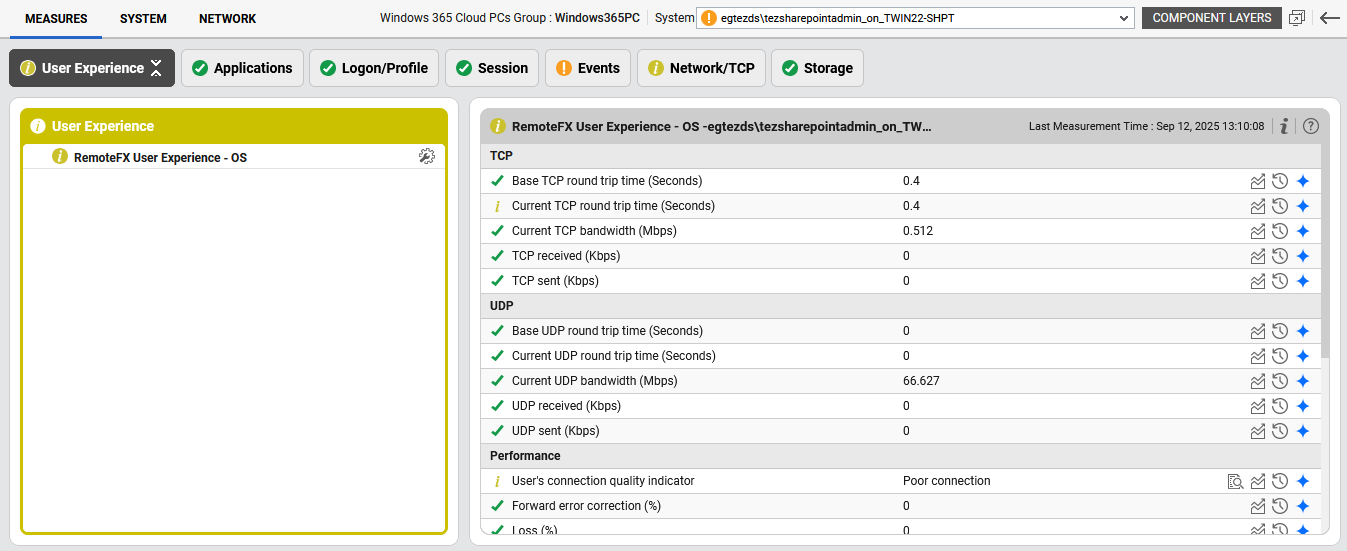
In Figure 3 that then appears, you will find a System drop-down that will display the cloud PC that you clicked on in Figure 2. You can switch to any other cloud PCs in the group by selecting that host from the System drop-down. The metrics related to the chosen cloud PC will then be displayed in the Measures tab page that appears below. These metrics will be organized and displayed in tab pages - one each for every layer. You can view the layers and the tests mapped to them by clicking on the Component Layers button at the right-corner. The will lead you to Figure 4.
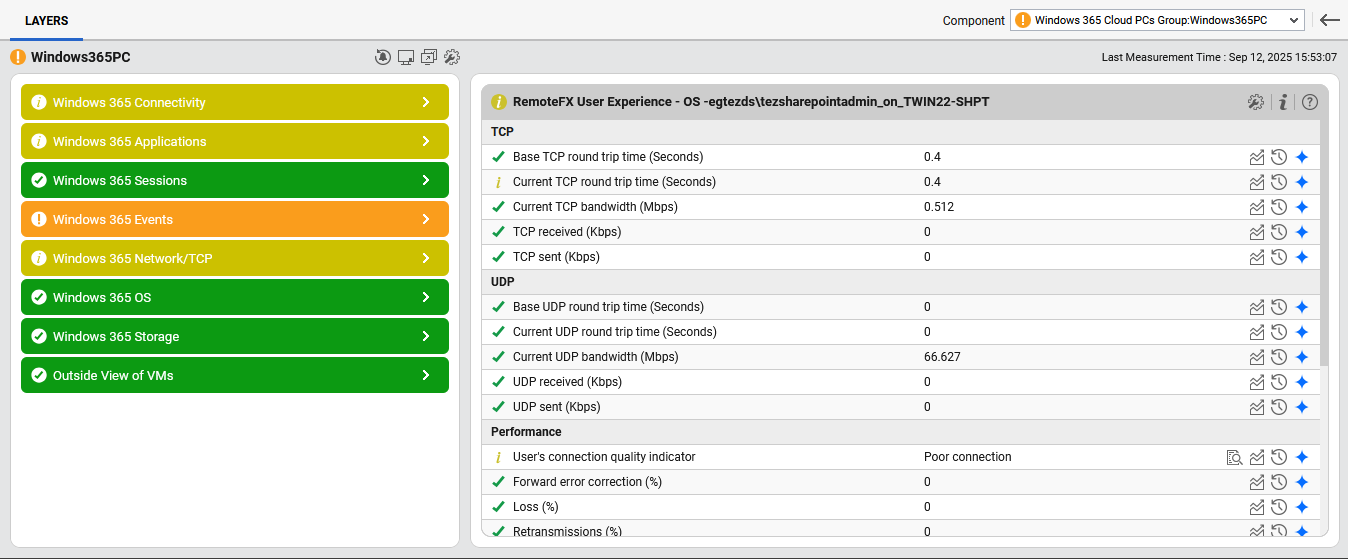
Figure 4 : The layer model of the Windows 365 Cloud PCs Group component
-
The Windows 365 Storage Layer / Storage Tab
The Windows 365 OS Layer / Operating System Tab
The Windows 365 Network/TCP Layer / Network/TCP Tab
The Windows 365 Events Layer / Events Tab
The Windows 365 Sessions Layer / Sessions Tab