In a recent blog article, we covered how the license changes for VMware virtualization may impact many of our partners and customers and are driving uncertainty in the market and causing many to consider their virtualization migration strategy, see Will Broadcom’s plans for VMware affect you? | eG Innovations. From our conversations with partners and customers, I am in no doubt that the uncertainty is real, and many are looking for alternative scenarios, being it on-premises on a different hypervisor platform or by moving workloads to a cloud provider. Reality is that migrations are always complex and time consuming, so a reasonable assumption is that at least for the coming years the result will be hybrid, by utilizing two or more hypervisors and often combined with Cloud workloads.
So, how does eG Enterprise help with virtualization migration?
In this article I will focus on how eG Enterprise supports any of the possible use cases customers are considering, and what specific eG Enterprise functionality helps to prepare, optimize, and maintain whatever the mid or long-term end environment looks like, covering:
- Universal monitoring of any hypervisor
- Quick and easy configuration of any hypervisor
- Monitoring and Alerting
- Cloud monitoring
- Application Performance Monitoring
As of today, eG Enterprise natively supports 500+ infrastructure components, Cloud providers and applications. Which means that we provide out-of-the-box deep insights, thresholds, dashboards and reports for any of these 500+ components.
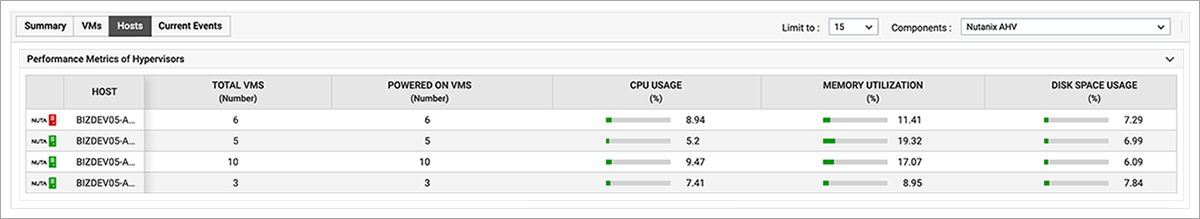
As part of the infrastructure components eG Enterprise supports any of the enterprise focused hypervisor platforms, including: Microsoft Hyper-V, Nutanix AHV, VMware ESXi / vSphere, RHEV, XenServer and more.
Functionally eG Enterprise has been universally/natively designed to support multiple hypervisors, so for every hypervisor vendor it works exactly the same. This means that for an administrator, monitoring ESXi today and AHV tomorrow, or combined, would make no difference from a monitoring perspective and requires no additional training.
Initial deployment and maintenance of a hypervisor cluster
eG Enterprise offers functionality to automatically discover and manage monitored components across the board. The same goes for automatically adding, managing and maintaining hypervisors.
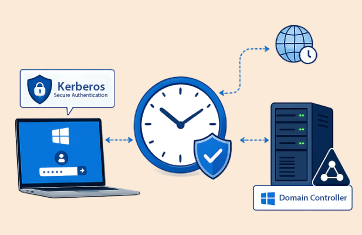
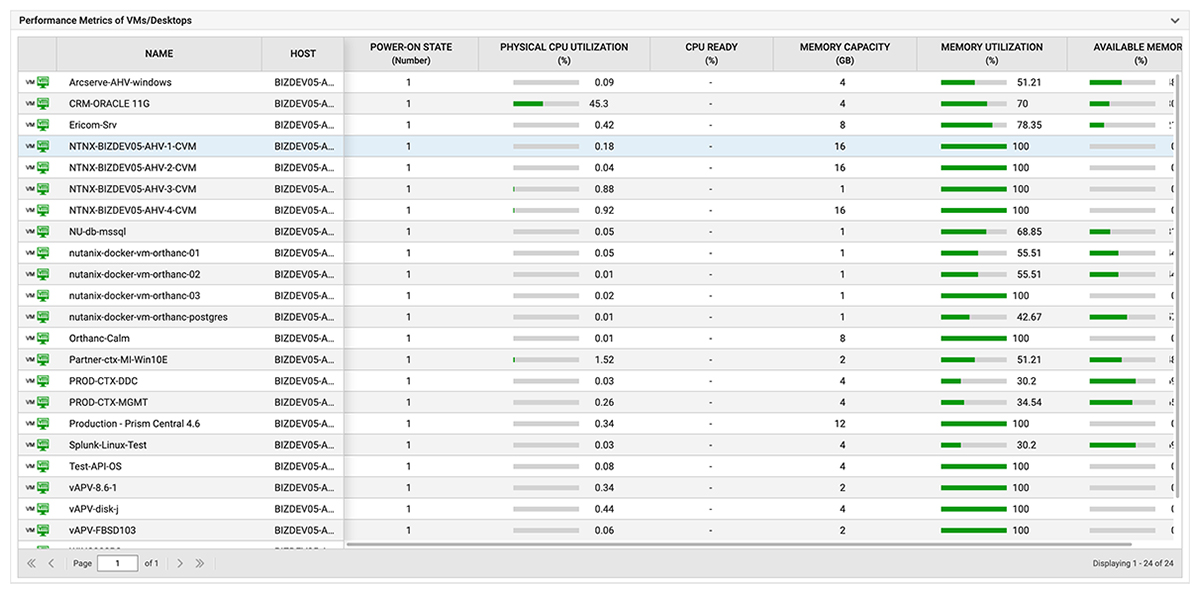
When you add either VMware vCenter or Nutanix Prism Central or Elements, eG will automatically discover and from there on maintain all cluster components, hosts and VMs managed by these virtualization management solutions.
This massively reduces the operation time massively by not having to do any manual work when configuration changes, better yet everything could be automated over the documented REST API that is offered out-of-the-box.
eG will even automatically discover whether a virtual machine is used as a VDI desktop and which VDI broker is used and automatically monitor it in the context of a VDI desktop.
Out-of-the-box, well thought out, static and automatic thresholds are instantly assigned which massively reduces alert false positives, removes manual calculation and configuration of thresholds, and reduces the time needed to tune alerts to a bare minimum.
Monitoring and alerting
The monitoring and alerting part is truly where eG Enterprise shines and stands out.
For every metric that’s being collected within eG Enterprise, out of the box we have implemented pre-configured thresholds settings where necessary according to industry best practices and consulting many of the field experts using eG Enterprise daily. This results in a highly optimized alert generation process generating contextual intelligent alerts while reducing alert fatigue. Typically, fine tuning of alerts is a matter of hours instead of months.
Many legacy monitoring tools are limited by offering only static thresholds. Static thresholds are fixed values that represent the limits of acceptable performance. For example, a server with more than 95% CPU utilization is likely to have a problem. In general, threshold configuration requires expertise; whilst server CPU usage is a widely well-understood metric, many admins would struggle to produce a similar number on the spot to act as a threshold for a metric such as “Blob success end-to-end latency (Seconds)” on an Azure storage disk. Beyond the need for significant domain-knowledge to set up thresholds on most metrics, static metrics simply are not suitable for measures that vary with time or with server. Where static thresholds are used in eG Enterprise they will be automatically configured for you ready-to-go.
Most enterprise and cloud monitoring solutions acknowledge the limitations of static thresholds by implementing machine learning technology and include an AIOps (Artificial Intelligence for IT Operations) engine capable of learning about the normal behavior of systems over multiple timeframes. This auto-baselining means that normal is understood with the context of time-of-day, day-of-the-week, monthly and seasonal variations. Once the real usage of a system has been established, this type of auto-baselining learns what is normal and dynamic thresholds can be applied e.g., raise an alert if the bandwidth used by a server exceeds 200% of normal usage.
One of the reasons that eG Enterprise avoids alert storms, alert instabilities and false alarms is its powerful capabilities for combining both static and dynamic alert thresholds. We have an overview of best ways to leverage static and dynamic thresholds available see: Static vs Dynamic Alert Thresholds for Monitoring | eG Innovations.
To ensure alerts and alarms are tracked and processed within their wider business processes and workflows many of our customers leverage eG Enterprise’s built-in integrations with ITSM tools. eG Enterprise alert integrations are provided for most major service incident and support ticketing systems including ServiceNow, Freshdesk, JIRA, Slack and many more. Many of our MSPs also leverage our capabilities to integrate with multiple ITSM solutions, which allows them to provide their customers with alert tracking within that particular customer’s ITSM system of choice, see: Integration with multiple ITSM tools at the same time (eginnovations.com) for details.
A free comprehensive whitepaper on thresholding and alerting best practice is also available, see: White Paper | Make IT Service Monitoring Simple & Proactive with AIOps Powered Intelligent Thresholding & Alerting (eginnovations.com).
Right Sizing and Capacity Planning for virtualization migration
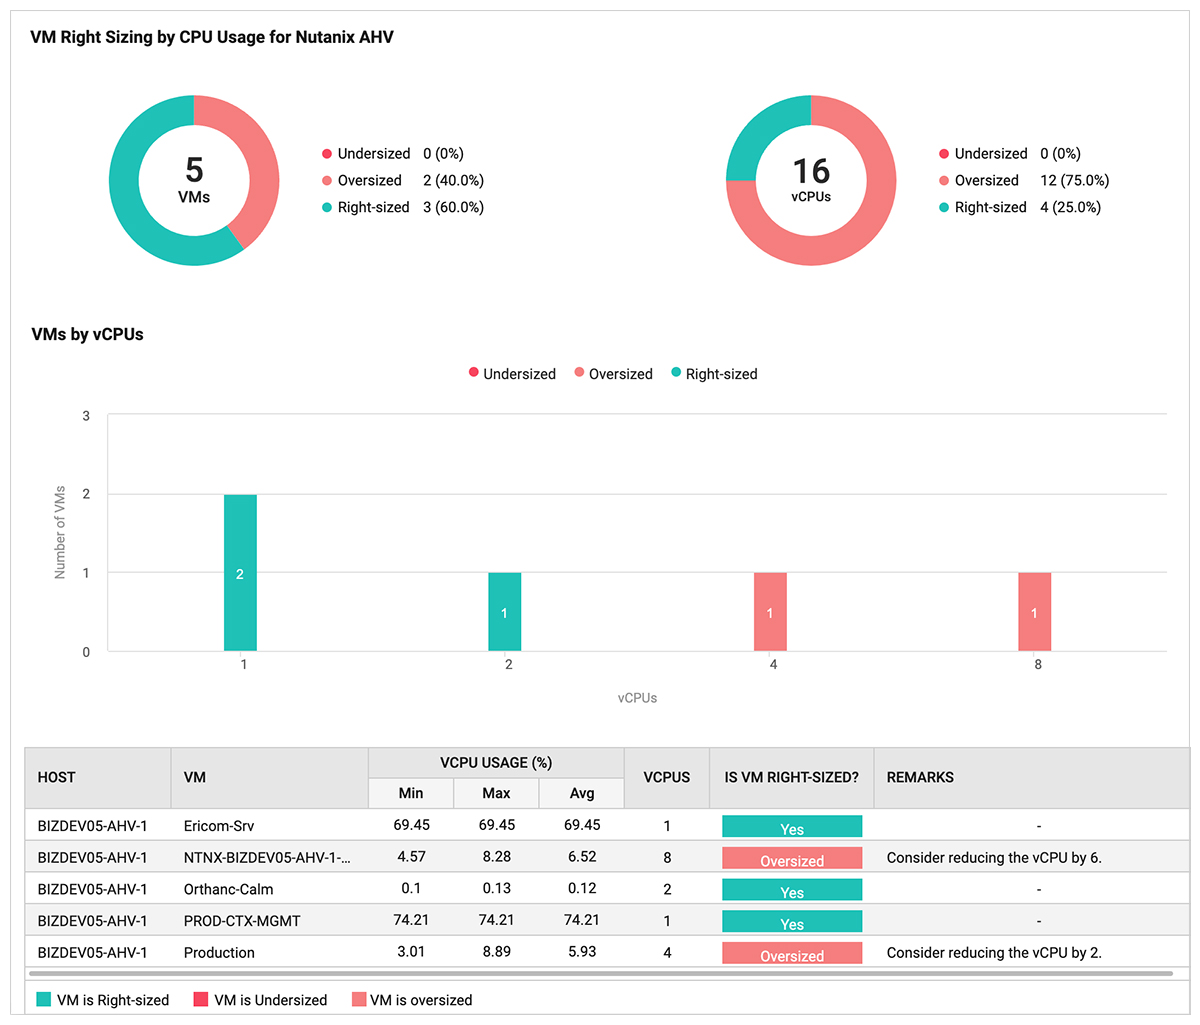
Knowing which virtual machines are running is one matter, but sizing for a virtualization migration to a new hypervisor or Cloud platform is more than just taking what you have and doing the same again. There is a lot to gain from making intelligent decisions regarding sizing and scalability. Virtualization migration is often an opportunity to improve performance and reliability and to optimize costs via modernization. See: Cloud migration vs modernization – What’s the difference? | eG Innovations to gain insights into the opportunities a platform migration may offer, and strategies commonly employed.
eG Enterprise offers ready-to-go reports to give you a clear picture of what is running and offers advice and recommendations on per VM sizing. Clear recommendations such as reducing the CPU and/or the Memory of a virtual machine highlight opportunities to reduce unnecessary resource consumption or wastage. Whilst recommendations to increase CPU and/or Memory are made that would make applications perform better and remove bottlenecks.
Cloud Platform support
eG Enterprise natively supports monitoring for many scenarios of workloads hosted at a cloud provider, being it as a native workload on a public cloud provider such as – AWS, Azure, GCP et cetera or as an extended service such as Nutanix Cloud Platform (where Nutanix AHV/AOS is hosted on AWS or Azure).
Native Cloud Infrastructure as a Service (IaaS)
By monitoring the cloud subscription, eG Enterprise offers insights into many of the virtual components that a customer is all too familiar with on-premises. Components such as network, storage and hypervisor information may seem less relevant as they are abstracted when consumed as a cloud service – however they still require the same careful planning and monitoring as compared to an on-premises scenario.
On top of monitoring the technical functional performance, eG Enterprise offers native functionality for cost management, prediction and alerting.
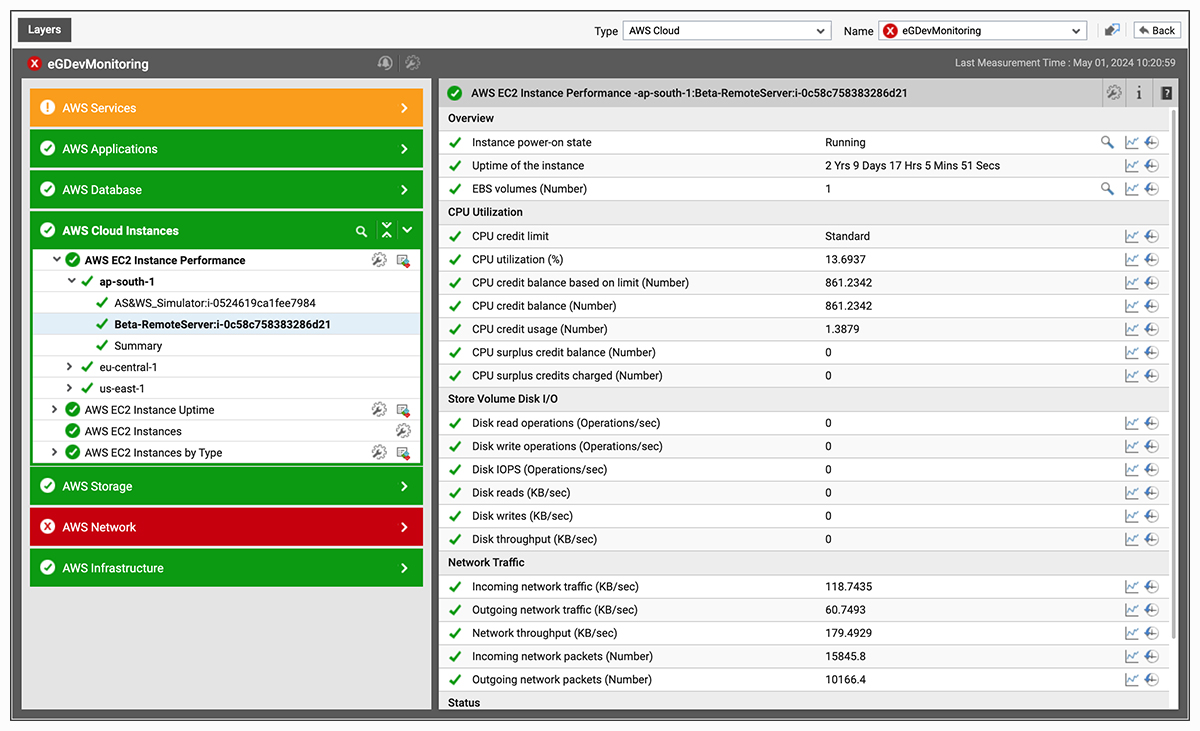
Infrastructure as a Service VMs
Virtual machines in the cloud are offered as an instance type, each consisting of a certain amount of virtual CPU, Memory and Disk. Whilst the number of CPU’s and GB’s is easy to understand, it’s often hard to figure out what type of CPU’s or disk resources are assigned, often leading to slower than expected performance and higher cost, especially when burstable instances are being used.
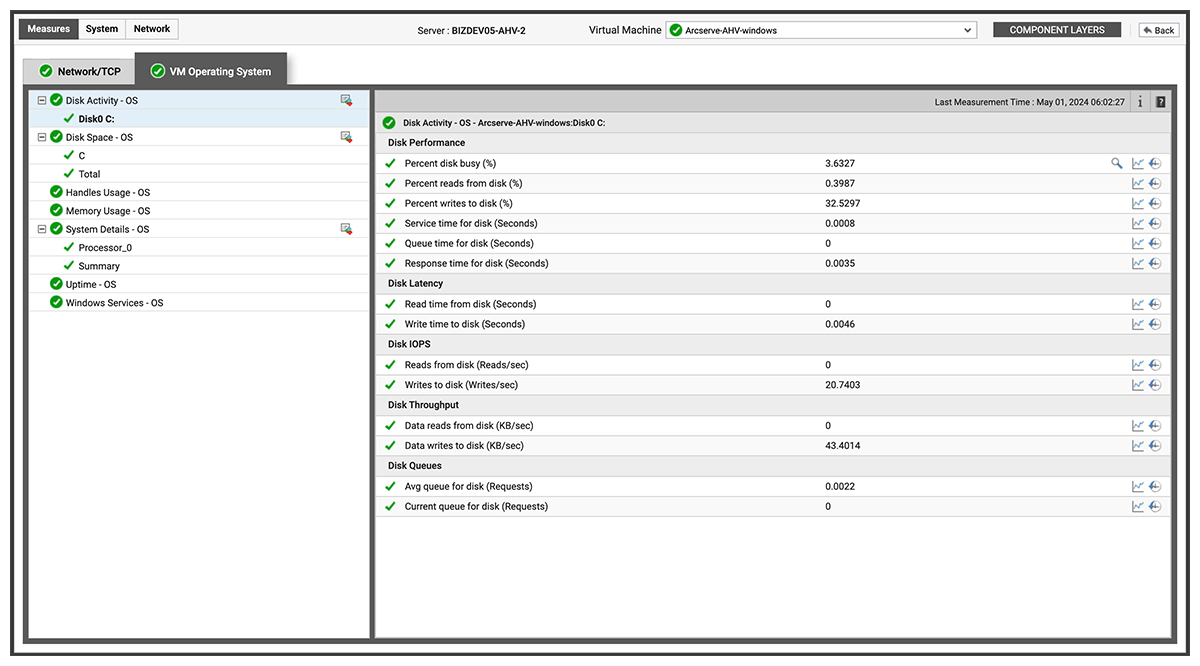
eG Enterprise offers out-of-the-box insights for any IaaS VM, instantly showing performance metrics, collected directly from the underlying (and invisible) hypervisor infrastructure, as well as information such as system uptime and bursting capabilities. Using out-of-the-box configured thresholds, eG Enterprise will automatically alert on any anomaly for a specific virtual machine instance, reducing MTTR.
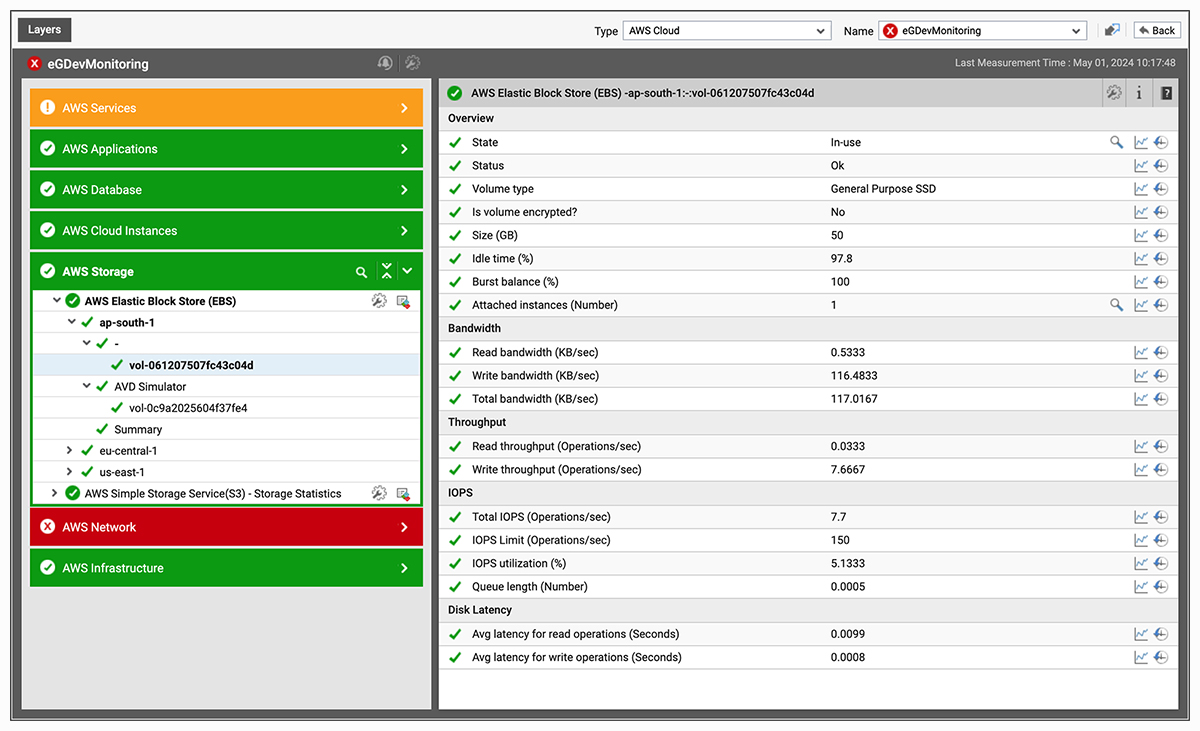
Storage
When consuming storage as part of a cloud service eG Enterprise offers insights into essential metrics like e.g. disk utilization, disk IOPS and disk latency. All of which can directly influence the user experience while working with applications.
Especially in cloud, storage performance is a complex matter, since the amount of IOPS is often hard limited based on the number of GBs consumed, so when running a IOPS heavy application this quickly leads to performance degradation.
Application Performance Monitoring
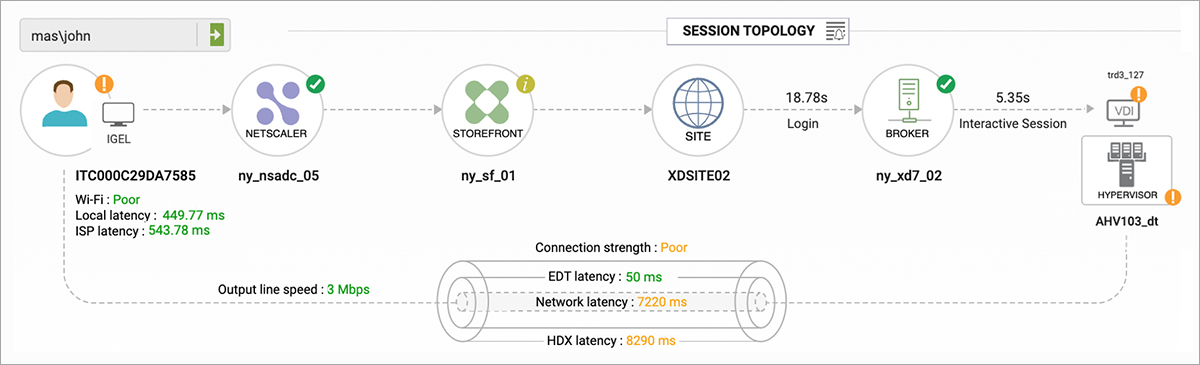
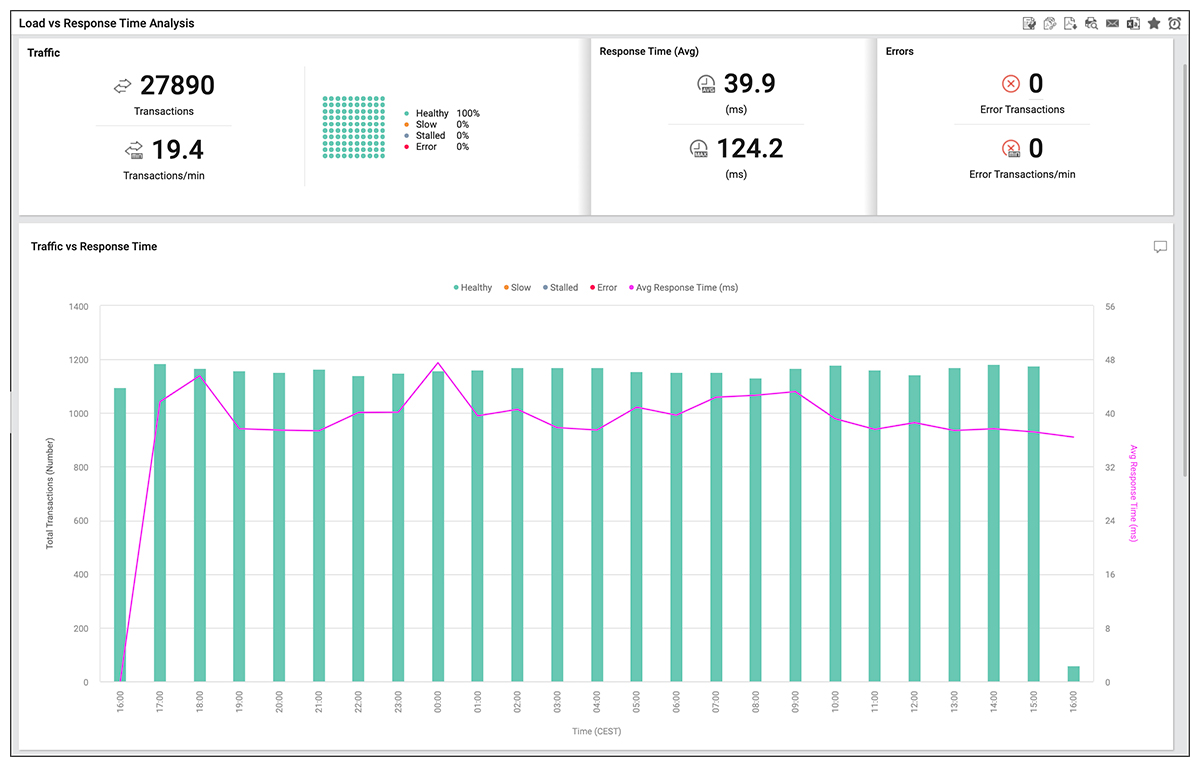
As part of the end to end it service monitoring vision, eG Enterprise offers extensive Application Performance Monitoring (APM) features to monitor and keep track of detailed user experience insights for any IT service. Being it a digital workspace service for employees, a web store for consumers or a productivity application for employees. All of which can be easily reported on based on XLA (eXperience Level Agreement) type of KPI’s,
By making APM part of the monitoring solution, business and IT can keep track of user experience before, during and after the virtualization migration. This allows for quick remediation of any impact on business or productivity.
Regarding APM, eG Enterprise offers many out-of-the-box features to monitor performance based on Real User Monitoring as well as Synthetic monitoring (see: Digital Experience Monitoring (DEM) – Synthetic vs Real User Monitoring for more information).
Final thoughts on virtualization migration
When looking to evaluate or undertake platform changes such as hypervisor migrations, virtualization migrations and migrations to the cloud, do look to ensure your monitoring platform helps you to prepare, optimize, and maintain whatever the mid or long-term end environment looks like. And seek out those key functionalities that will help you:
eG Enterprise is an Observability solution for Modern IT. Monitor digital workspaces,
web applications, SaaS services, cloud and containers from a single pane of glass.
- Universal monitoring of any hypervisor
- Quick and easy configuration of any hypervisor
- Monitoring and Alerting
- Cloud monitoring
- Application Performance Monitoring
eG Enterprise is an Observability solution for Modern IT. Monitor digital workspaces,
web applications, SaaS services, cloud and containers from a single pane of glass.
Learn more
- Everything you ever needed to know (and more!) about best-practices for threshold setting and metric alerting to improve accuracy and avoid manual effort: White Paper | Make IT Service Monitoring Simple & Proactive with AIOps Powered Intelligent Thresholding & Alerting (eginnovations.com).
- Confused by the terminology around cloud and platform migrations? Learn the nuances of Rehosting vs Replatforming vs Refactoring and so on, see: Cloud migration vs modernization – What’s the difference? | eG Innovations.
- Read about our long history in multi-hypervisor monitoring: Hypervisor and Multi-hypervisor Monitoring | eG Innovations.
 Barry is a pre-sales consultant at eG Innovations. Barry has 20+ years of IT experience and deep knowledge in Citrix technologies and is a specialist on Microsoft Windows, Desktop and Server virtualization and application delivery with Citrix ADC. Barry is an active community contributor and former Citrix Technology Professional. He is one of the co founders and a member of the board of the Dutch Citrix User.