Proactive /prəʊˈaktɪv/
Adjective: (of a person or action) creating or controlling a situation rather than just responding to it after it has happened.
What is Proactive Monitoring?
 Proactive monitoring involves continuously identifying potential issues within IT infrastructure and applications before they escalate into significant challenges. This approach allows businesses to address problems before they cause application crashes or performance degradation. By resolving issues early, proactive monitoring ensures smoother operations and enhances user experience.
In practice, proactive monitoring detects potential problems before users notice and complain, thus avoiding business impacts. Unlike reactive monitoring, which identifies failures after they occur, proactive monitoring alerts IT administrators to issues well in advance. This allows for timely intervention, maintaining optimal performance and reliability. Proactive monitoring means constantly searching for signs that indicate a problem is about to happen, enabling businesses to operate more efficiently and effectively.
Proactive monitoring is the opposite of reactive monitoring. While reactive monitoring detects failures after something has gone wrong, proactive monitoring alerts IT administrators to potential issues well before the issue becomes a failure.
By avoiding business impacting failures, proactive monitoring helps to enhance service uptime and performance, increases customer trust, and enables increased efficiency in IT operations.
Formal Industry Standards Around Proactive Monitoring
![]() The AWS MSP Partner Program Validation Audit Checklist contains a useful set of criteria of how AWS want MSPs to proactively build services upon AWS and WorkSpaces, including:
The AWS MSP Partner Program Validation Audit Checklist contains a useful set of criteria of how AWS want MSPs to proactively build services upon AWS and WorkSpaces, including:
“AWS Partner offers next-generation monitoring for critical customer workloads. This provides comprehensive monitoring and alerting capabilities that cover all components and layers of the workload, not just the AWS services and resources. This provides operators with visibility into workload health and performance and proactively notifies operators of potential service impacts. The partner has standardized approaches for collecting, integrating, monitoring, and alerting on workload health and performance data at both the infrastructure and application layers, as well as across multiple components of the workload.“
Basically, Amazon expects MSPs to have monitoring in place that will detect potential service impacts so that service impacts are avoided for end-users. This is where synthetic monitoring simply doesn’t cut it, especially if it does not go beyond Logon Simulations.
Amazon also expects a “standardized approach for collecting, integrating, monitoring, and alerting on workload health and performance data at both the infrastructure and application layers”.
Synthetic Monitoring is Useful but Not Sufficient for Proactive Monitoring
 Many monitoring products promise to “proactively monitor your business applications”. When you dig deeper though, you will find that their offering amounts to little more than continuous synthetic transaction testing on the availability of applications, desktops, and network resources – and are often little more than basic logon simulators. Synthetic transaction testing essentially uses robot users to try and access resources. As synthetic monitoring runs 24×7, it may be able to detect problems before real users encounter them because it is accessing the application/IT infrastructure at times when real users may not. For example, a logon failure at 3am may be detected by synthetic monitoring. Real users may not login at that time, so they may not notice the issue until they login at 7am.
However, synthetic monitoring simply isn’t true “proactive monitoring” as all you have done is discover a problem that has already occurred. True proactive monitoring should be able to detect problems in advance, even when users are actively accessing the applications/infrastructure being monitored.
A Medical Analogy
 Using a synthetic monitoring tool is akin to taking a temperature check on a person. When the temperature is abnormal, you know that there is an issue. But by the time you know that the temperature is abnormal, it is probably late already – the person is sick! Proactive checks of other key parameters – blood pressure, blood glucose level, etc. may provide early warning indicators of problems.
What is Needed for True Proactive IT Monitoring
Metrics like service availability and response time are important for assessing performance vs. SLAs. However, they do not provide proactive indicators of a problem. These metrics are often indicative of effects of a problem (symptoms), but the actual problem may be somewhere else.
There are many other IT metrics that can provide early warning indicators of problems. For example:
- Handle leaks in an application: On Microsoft Windows, applications use handles. A handle is a unique identifier for a resource that is managed by the OS kernel. A handle can be a window, a file, a socket, etc. The operating system maintains a finite number of handles and applications use handles as needed and release them when they no longer require them. This ensures that resources not in use are freed up in the operating system. Programming errors, software bugs, and incompatibilities between software can cause programs to hold on to handles they no longer need. Such a scenario causes a handle leak. Handle leaks can lead to sluggish performance, system instability, or in extreme cases, an application or server crash. Proactive monitoring tools monitor and report on handle leaks. Early detection of such issues can provide advance notice to administrators, who can then initiate action to alleviate the issue (e.g., raise the bug with the software vendor, reboot the system overnight to avoid the problem from escalating).
- A gradual increase in a Java application’s heap usage: Memory leaks can also occur in application code – e.g., objects are allocated but not released. In a Java application, for example, the application’s memory usage is limited by the maximum limit set for heap memory. Application memory leaks result in the heap memory being utilized to its fullest. While such issues may not lead to a server crash, the application may become slow over time. Synthetic monitoring has very limited use in such cases. By the time slowness is detected in this approach, it is likely that users are experiencing issues.
- Packet drops on a router: On a network device, it is important to track the packets discarded during reception or transmission, possibly because the buffer available is not sufficient. Errors on the network are also a sign of a poor network connection. While a small percentage of errors may not affect the user experience, if the issue is left unattended, the percentage of errors may increase over time and ultimately affect the service performance.
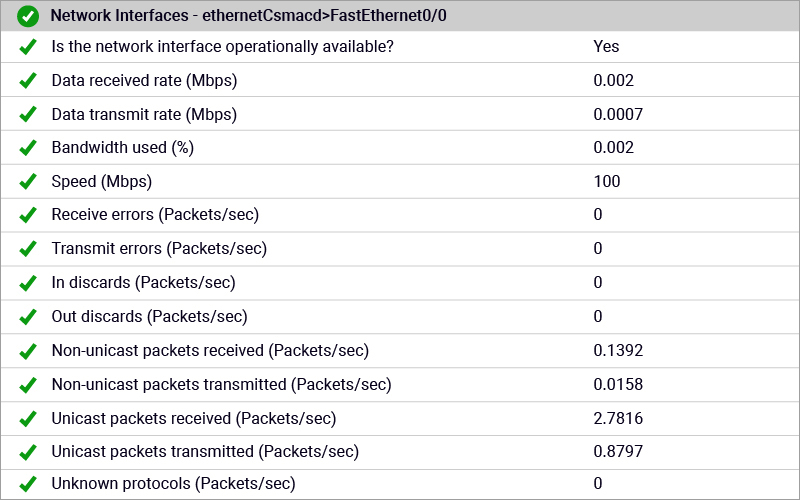
eG Enterprise includes support for numerous networking technologies (see the Networking tab) including MikroTik routers, Riverbed Steelhead SD, F5 BIG-IP, Access Policy Manager, jetNEXUS Load Balancer, Routers and switches from 3Com, Dell and HPE, Cisco BGP & QOS monitoring support for Cisco routers.
5 Best Practices Proactive Monitoring within IT Operations
Based on the above analysis, here are five best practices we recommend that organizations follow to make their IT operations truly proactive:
- Use user experience monitoring judiciously. It is important that your IT administrators know about problems before users notice and complain. As we described above, user experience monitoring can provide indications of a problem with your application and infrastructure. With 24×7 synthetic monitoring in place, they can begin working on a problem as soon as it is detected and even resolve it before a majority of users notice it.
- Be sure to monitor early warning performance indicators. As we saw in our earlier discussion, there are a set of metrics that can provide administrators early warning indicators. Make sure your monitoring tools are configured to track and alert on such indicators.
- Use auto-baselining to simplify IT operations, and at the same time, get early warning alerts. Alerting based on fixed thresholds put too much burden on the IT admins to configure the right thresholds. Modern monitoring tools have the ability to learn from past history and to automatically set baselines based on norms of past performance. Adopt such technologies as they will alert you to abnormal usage patterns that you may not have been aware of otherwise.
- Ensure that your IT operations’ processes are aligned with your monitoring tools and your customer SLAs. Proactive alerts are of no use if they are not acted upon. Often, IT operations teams get a flood of alerts and over time, they start to ignore the alerts from the monitoring tool. Make sure that you are continuously assessing the alerts from the monitoring tool and tuning it as required to make sure that all alerts you receive are valid and will be acted upon.
- Being proactive also includes intelligent capacity planning. Performance issues may occur because of insufficient capacity in some cases. Make sure you plan in advance so that you can augment your system capacities to avert any potential issues down the line.
AIOps Capabilities form the Essence of how eG Enterprise is Proactive
eG Enterprise is built around an AIOps (Artificial Intelligence for IT Operations) platform providing capabilities that form the essence of eG Enterprise’s proactive root cause analysis and anomaly detection capabilities. You can read more about these capabilities, which will enable you to become more proactive:
eG Enterprise is an Observability solution for Modern IT. Monitor digital workspaces,
web applications, SaaS services, cloud and containers from a single pane of glass.
- Embedded domain expertise for metrics collection
- Auto-baselining for proactive problem detection
- Automatic problem diagnosis
- Top-to-bottom, end-to-end auto-correlation
- Auto-discovery and dependency mapping
- Metric aggregation and service quality indicators
- Bottleneck detection, Forecasting and capacity planning
- Automatic correction and remediation
Learn More
- Read more about Proactive IT Performance Monitoring – Case Study | eG Innovations
- AIOps Tools – 8 Proactive Monitoring Tips | eG Innovations
- Proactive Monitoring for Virtual Workspaces – Atos Case Study (eginnovations.com)
- Proactive IT Monitoring to Address IT Challenges at eBay (eginnovations.com)
- Download our AIOps Solutions & Strategies eBook now
 Rachel has worked as developer, product manager and marketing manager at Cloud, EUC, application and hardware vendors such as Citrix, IBM, NVIDIA and Siemens PLM. Rachel now works on technical content and engineering and partner liaison for eG Enterprise