Fabric Interconnect Fans Test
The Cisco UCS Fabric Interconnects comprise of two slots on the front of the chassis for fan modules. Each fan module houses six fans. The combination of six fans for each module and two modules provides the chassis with 12 fans. Use this test to closely monitor the availability, overall health, and performance of each of these fans and report anomalies so that, you can promptly initiate measures to ensure that adequate air flow is available in the fabric interconnects.
Target of the test : A Cisco UCS manager
Agent deploying the test : A remote agent
Outputs of the test : One set of results for each fan in each fabric interconnect managed by the Cisco UCS manager being monitored.
| Parameter | Description |
|---|---|
|
Test Period |
How often should the test be executed. |
|
Host |
The IP address of the host for which the test is being configured. |
|
Port |
The variable name of the port at which the specified host listens. |
|
UCS User and |
Provide the credentials of a user with at least read-only privileges to the target Cisco UCS manager. |
|
Confirm Password |
Confirm the password by retyping it here. |
|
SSL |
By default, the Cisco UCS manager is SSL-enabled. Accordingly, the SSL flag is set to Yes by default. |
|
Web Port |
By default, in most virtualized environments, Cisco UCS manager listens on port 80 (if not SSL-enabeld) or on port 443 (if SSL-enabled) only. This implies that while monitoring Cisco UCS manager, the eG agent, by default, connects to port 80 or 443, depending upon the SSL-enabled status of Cisco UCS manager - i.e., if Cisco UCS manager is not SSL-enabled (i.e., if the SSL flag above is set to No), then the eG agent connects to Cisco UCS manager using port 80 by default, and if Cisco UCS manager is SSL-enabled (i.e., if the SSL flag is set to Yes), then the agent-Cisco UCS manager communication occurs via port 443 by default. Accordingly, the WebPort parameter is set to default by default. In some environments however, the default ports 80 or 443 might not apply. In such a case, against the WebPort parameter, you can specify the exact port at which the Cisco UCS manager in your environment listens, so that the eG agent communicates with that port for collecting metrics from the Cisco UCS manager. |
|
Detailed Diagnosis |
To make diagnosis more efficient and accurate, the eG Enterprise embeds an optional detailed diagnostic capability. With this capability, the eG agents can be configured to run detailed, more elaborate tests as and when specific problems are detected. To enable the detailed diagnosis capability of this test for a particular server, choose the On option. To disable the capability, click on the Off option. The option to selectively enable/disable the detailed diagnosis capability will be available only if the following conditions are fulfilled:
|
| Measurement | Description | Measurement Unit | Interpretation | ||||||||||||||||||||||||||||||||||||||||||||||||||||||||
|---|---|---|---|---|---|---|---|---|---|---|---|---|---|---|---|---|---|---|---|---|---|---|---|---|---|---|---|---|---|---|---|---|---|---|---|---|---|---|---|---|---|---|---|---|---|---|---|---|---|---|---|---|---|---|---|---|---|---|---|
|
Overall status |
Indicates the overall status of this fan in this fabric interconnect. |
|
The States reported by this measure and their corresponding numeric equivalents are described in the table below:
Note: By default, this measure reports the above-mentioned States while indicating the overall status of a fan. However, in the graph of this measure, states will be represented using their corresponding numeric equivalents only. The detailed diagnosis of this measure provides the Time, ID, PID, Module, Revision, Serial Number, Tray and Vendor attributes for each fan in the fabric interconnect. |
||||||||||||||||||||||||||||||||||||||||||||||||||||||||
|
Operability |
Indicates the current operating state of this fan in this fabric interconnect. |
|
The States reported by this measure and their corresponding numeric equivalents are described in the table below:
Note: By default, this measure reports the above-mentioned States while indicating the operational state of a fan. However, in the graph of this measure, states will be represented using their corresponding numeric equivalents only. |
||||||||||||||||||||||||||||||||||||||||||||||||||||||||
|
Performance state |
Indicates the current performance state of this fan in this fabric interconnect. |
|
The States reported by this measure and their corresponding numeric equivalents are described in the table below:
Note: By default, this measure reports the above-mentioned States while indicating the performance state of a fan. However, in the graph of this measure, states will be represented using their corresponding numeric equivalents only. |
||||||||||||||||||||||||||||||||||||||||||||||||||||||||
|
Power state |
Indicates the current power state of this fan in this fabric interconnect. |
|
The States reported by this measure and their corresponding numeric equivalents are described in the table below:
Note: By default, this measure reports the above-mentioned States while indicating the power state of a fan. However, in the graph of this measure, states will be represented using their corresponding numeric equivalents only. |
||||||||||||||||||||||||||||||||||||||||||||||||||||||||
|
Presence state |
Indicates the current state of this fan in this fabric interconnect. |
|
The States reported by this measure and their corresponding numeric equivalents are described in the table below:
Note: By default, this measure reports the above-mentioned States while indicating the current state of a fan. However, in the graph of this measure, states will be represented using their corresponding numeric equivalents only. |
||||||||||||||||||||||||||||||||||||||||||||||||||||||||
|
Thermal state |
Indicates the current thermal state of this fan in this fabric interconnect. |
|
The States reported by this measure and their corresponding numeric equivalents are described in the table below:
Note: By default, this measure reports the above-mentioned States while indicating the current thermal state of a fan. However, in the graph of this measure, states will be represented using their corresponding numeric equivalents only. |
||||||||||||||||||||||||||||||||||||||||||||||||||||||||
|
Voltage state |
Indicates the current voltage state of this fan in this fabric interconnect. |
|
The States reported by this measure and their corresponding numeric equivalents are described in the table below:
Note: By default, this measure reports the above-mentioned States while indicating the current voltage state of a fan. However, in the graph of this measure, states will be represented using their corresponding numeric equivalents only. |
The detailed diagnosis of the Overall status measure provides the Time, ID, PID, Module, Revision, Serial Number, Tray and Vendor attributes for each fan in the fabric interconnect.
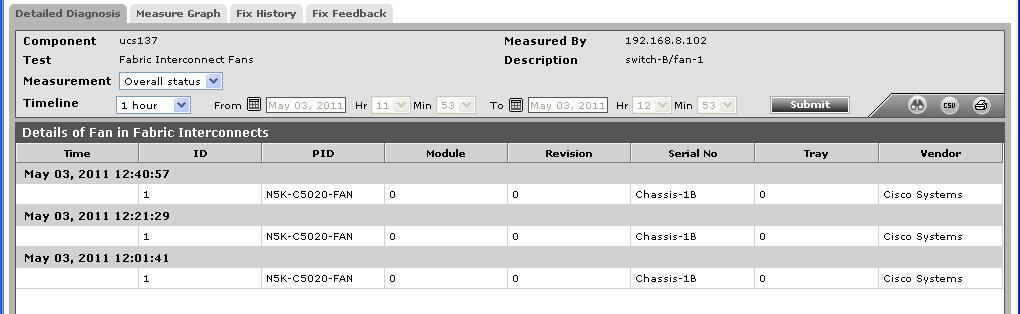
Figure 1 : The detailed diagnosis of the Overall status measure of the Fabric Interconnect Fans test