Call Quality Check Test
The quality of Real-Time media (audio, video, and application sharing) over IP is greatly impacted by the quality of end-to-end network connectivity. For optimal Microsoft Teams media quality, it is important for you to make sure there is a high-quality connection between your organization's network and Microsoft Teams. The best way to accomplish this is to set up your internal network and cloud connectivity based on the capacity of your network to accommodate for peak traffic volume for Microsoft Teams across all connections. There are many different factors that contribute to Microsoft Teams Real-Time media (audio, video, and application sharing) quality that include the devices that are used, the environment, and the network connectivity. However, the quality of the Real-Time media over IP network is greatly impacted by the quality of network connectivity. Few major factors that affect the quality of network connectivity are latency, packet loss and jitter. Therefore, it is essential for the administrators to keep a check on these factors while monitoring the Connectivity performance of Microsoft Teams. The Call Quality Check helps administrators achieve this!
This test monitors the connectivity performance of the target Microsoft Teams by reporting the Mean opinion score of the users accessing the Microsoft Teams. This test also reveals the status of call connectivity check on Microsoft Teams as well as the count of calls that were initiated/completed/failed. Using this test, administrators can figure out the calls that experienced heavy packet loss; how frequently packets were lost and thus ascertain the overall user experience on Microsoft Teams.
Target of the test : Microsoft Teams
Agent deploying the test : A remote agent
Outputs of the test : One set of results for the monitored Microsoft Teams
| Parameters | Description |
|---|---|
|
Test period |
How often should the test be executed |
|
Host |
The host for which the test is to be configured. By default, this is portal.office.com |
|
Port |
The port at which the specified Host listens to. By default, this is NULL. |
|
DD Frequency |
Refers to the frequency with which detailed diagnosis measures are to be generated for this test. The default is 1:1. This indicates that, by default, detailed measures will be generated every time the test runs, and also every time the test detects a problem. You can modify this frequency, if you so desire. Also, if you intend to disable the detailed diagnosis capability for this test, you can do so by specifying none against DD Frequency. |
|
Detailed Diagnosis |
To make diagnosis more efficient and accurate, the eG Enterprise embeds an optional detailed diagnostic capability. With this capability, the eG agents can be configured to run detailed, more elaborate tests as and when specific problems are detected. To enable the detailed diagnosis capability of this test for a particular server, choose the On option. To disable the capability, click on the Off option. The option to selectively enabled/disable the detailed diagnosis capability will be available only if the following conditions are fulfilled:
|
| Measurement | Description | Measurement Unit | Interpretation | ||||||||||||||
|---|---|---|---|---|---|---|---|---|---|---|---|---|---|---|---|---|---|
|
Mean opinion score |
Indicates the Mean Opinion Score experienced by the users. |
|
Mean Opinion Score is a combination of jitter, packet loss, and to a lesser degree the increased round-trip time. The values reported by this measure and its numeric equivalents are mentioned in the table below:
Note: By default, this measure reports the Measure Values listed in the table above to indicate the Mean Opinion Score. The graph of this measure however, represents the Mean Opinion Score using the numeric equivalents only - 1 to 6. |
||||||||||||||
|
Service verification status |
Indicates the current status of call connectivity check. |
|
The values reported by this measure and its numeric equivalents are mentioned in the table below:
Note: By default, this measure reports the States listed in the table above to indicate the current status of connectivity check. The graph of this measure however, is represented using the numeric equivalents only i.e., 0 or 1. The detailed diagnosis of this measure lists the reason behind connectivity check failures. |
||||||||||||||
|
RTT latency |
Indicates the time taken by an IP packet to travel from one point to another over the network during the last measurement period. |
Milliseconds |
This network propagation delay is essentially tied to physical distance between the two points and the speed of light, including additional overhead taken by the various routers in between. |
||||||||||||||
|
Packet reorder ratio |
Indicates the ratio of packets that were reordered, in terms of percentage. |
Percent |
Ideally, the value of this measure should be close to zero. Packet reordering (i.e., when packets arrive in a different order than that in which they were sent) can be recognized as packet loss or as a congestion signal by most network protocol (like TCP). Therefore, they impact the network just like how packet loss impacts. Also, they directly impact the packet sending rate which will increase the round-trip time. As a result, the call will be distorted and will cut out at times. |
||||||||||||||
|
Packet loss rate |
Indicates the rate at which packets were lost during call in a given window of time, in terms of percentage. |
Percent |
Packet loss directly affects audio quality—from small, individual lost packets having almost no impact, to back-to-back burst losses that cause complete audio cut-out. Therefore, ideally, the value of this measure should be zero. The detailed diagnosis of this measure lists the call start time, the packet loss rate, the packets sent, the packets received, roundtrip latency of the call, the average jitter recorded and the packet reorder ratio. |
||||||||||||||
|
Jitter |
Indicates the average time delay between successive packets during the last measurement period. |
Milliseconds |
Most modern VoIP software such as Skype for Business, Microsoft Teams etc can adapt to some levels of jitter through buffering. When the jitter exceeds the buffering, a participant will notice the effects of jitter. The packets arriving at different speeds cause a speaker's voice to sound robotic. Also, jitter may increase end-to-end latency. |
||||||||||||||
|
Calls initiated |
Indicates the number of calls initiated during the last measurement period. |
Number |
|
||||||||||||||
|
Calls failed |
Indicates the number of calls that failed during the last measurement period. |
Number |
A low value is desired for this measure. The detailed diagnosis of this measure lists the call start time, the packet loss rate, the packets sent, the packets received, roundtrip latency of the call, the average jitter recorded, the packet reorder ratio and the failed connection checks. |
||||||||||||||
|
Calls completed |
Indicates the number of calls that were completed during the last measurement period. |
Number |
|
||||||||||||||
|
Infra connectivity errors |
Indicates the number of Infra connectivity errors during the last measurement period. |
Number |
A low value is desired for this measure. The detailed diagnosis of this measure lists the reason behind Infra connectivity failures. |
||||||||||||||
|
Total connections |
Indicates the count of total URL connections during the last measurement period. |
Number |
|
||||||||||||||
|
Successful connections |
Indicates the number of successful URL connections during the last measurement period. |
Number |
A high value is desired for this measure. |
||||||||||||||
|
Failed connections |
Indicates the number of failed URL connections during the last measurement period. |
Number |
A low value is desired for this measure. The detailed diagnosis of this measure lists the reason behind URL connectivity failures. |
||||||||||||||
|
ECS total connections |
Indicates the count of total ECS connections during the last measurement period. |
Number |
|
||||||||||||||
|
ECS successful connections |
Indicates the number of successful ECS connections during the last measurement period. |
Number |
A high value is desired for this measure. |
||||||||||||||
|
ECS failed connections |
Indicates the number of failed ECS connections during the last measurement period. |
Number |
A low value is desired for this measure. The detailed diagnosis of this measure lists the reason behind ECS connectivity failures. |
The detailed diagnosis of the Packet loss rate measure reveals the call start time, the packet loss rate, the packets sent, the packets received, roundtrip latency of the call, the average jitter recorded and the packet reorder ratio. You may want to check the detailed diagnostics periodically to figure out when the packet loss rate was at peak and start investigating on why packets were being lost considerably.

Figure 1 : The detailed diagnostics of the Packet loss rate measure
The detailed diagnosis of the Connectivity checks status measure lists the reason (message) behind connectivity check failures.
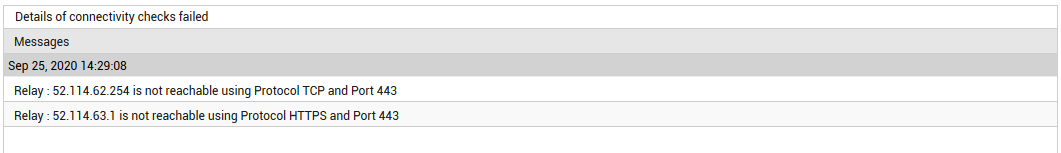
Figure 2 : The detailed diagnosis of the Connectivity checks status measure