Calls Summary Test
To figure out the Microsoft Teams call quality of the users across the organization, administrators can use the Calls Summary test.
Using this test, administrators can figure out the total count of call streams that were established across the organization. This test also reveals the count of calls that were successful. Dropped calls are promptly captured and alerted. The average call duration helps administrators rate the user experience on Microsoft Teams. This test also capture media failures and helps administrators determine the reason on why media failures are noticed - is it due to firewall DPI? or is it dow to firewall IP block? or is it due to any other reason?
Target of the test : Microsoft Teams
Agent deploying the test : A remote agent
Outputs of the test : One set of results for the monitored Microsoft Teams
| Parameters | Description |
|---|---|
|
Test period |
How often should the test be executed |
|
Host |
The host for which the test is to be configured. By default, this is portal.office.com |
|
Tenant Name |
Azure AD certificate-based authentication (CBA) enables customers to allow or require users to authenticate with X.509 certificates against their Azure Active Directory (Azure AD) for applications and browser sign-in. This test requires a valid X.509 certificate, so that it can securely access the target tenant and its resources. For this purpose, you should do the following:
|
|
O365 User Name, O365 Password, and Confirm Password |
For execution, this test requires the privileges of an O365 user who has been assigned the Service support admin role and is vested with the View-Only Audit Logs and Team administrator permission. Configure the credentials of such a user against O365 User Name and O365 Password text boxes. Confirm the password by retyping it in the Confirm Password text box. While you can use the credentials of any existing O365 user with the afore-said privileges, it is recommended that you create a special user for monitoring purposes using the Office 365 portal and use the credentials of that user here. To know how to create a new user using the Office 365 portal and assign the required privileges to that user, refer to Creating a New User in the Office 365 Portal |
|
Domain Name, Domain User Name, Domain Password, and Confirm Password |
These parameters are applicable only if the eG agent needs to communicate with the Office 365 portal via a Proxy server. In this case, in the Domain text box, specify the name of the Windows domain to which the eG agent host belongs. In the Domain User Name text box, mention the name of a valid domain user with login rights to the eG agent host. Provide the password of that user in the Domain Password text box and confirm that password by retyping it in the Confirm Password text box. On the other hand, if the eG agent is not behind a Proxy server, then you need not disturb the default setting of these parameters. By default, these parameters are set to none. |
|
Proxy Host, Proxy Port, Proxy User Name, Proxy Password and Confirm Password |
These parameters are applicable only if the eG agent needs to communicate with the Office 365 portal via a Proxy server. In this case, provide the IP/host name and port number of the Proxy server that the eG agent should use in the Proxy Host and Proxy Port parameters, respectively. If the Proxy server requires authentication, then specify the credentials of a valid Proxy user against the Proxy User Name and Proxy Password text boxes. Confirm that password by retyping it in the Confirm Password text box. If the Proxy server does not require authentication, then specify none against the Proxy User Name, Proxy Password, and Confirm Password text boxes. On the other hand, if the eG agent is not behind a Proxy server, then you need not disturb the default setting of any of the Proxy-related parameters. By default, these parameters are set to none. |
|
Show Top N DD |
By default, this parameter is set to 10, indicating that the detailed diagnostics will report the top-10 streams. You can change the 'N' in Show Top N DD by specifying any number of your choice in this text box. |
|
DD Frequency |
Refers to the frequency with which detailed diagnosis measures are to be generated for this test. The default is 1:1. This indicates that, by default, detailed measures will be generated every time the test runs, and also every time the test detects a problem. You can modify this frequency, if you so desire. Also, if you intend to disable the detailed diagnosis capability for this test, you can do so by specifying none against DD Frequency. |
|
Detailed Diagnosis |
To make diagnosis more efficient and accurate, the eG Enterprise embeds an optional detailed diagnostic capability. With this capability, the eG agents can be configured to run detailed, more elaborate tests as and when specific problems are detected. To enable the detailed diagnosis capability of this test for a particular server, choose the On option. To disable the capability, click on the Off option. The option to selectively enabled/disable the detailed diagnosis capability will be available only if the following conditions are fulfilled:
|
| Measurement | Description | Measurement Unit | Interpretation |
|---|---|---|---|
|
Total streams |
Indicates the total number of call streams. |
Number |
|
|
Short call percentage |
Indicates the percentage of calls that were less than 1 minute long. |
Percentage |
|
|
Other reasons failure percentage |
Indicates the percentage of streams where media path could not be established between the endpoints due to an undetermined/unclassified reason. |
Percentage |
|
|
Media succeeded streams |
Indicates the number of streams where media path was established and terminated normally. |
Number |
|
|
Media failure percentage |
Indicates the percentage of streams where either media path could not be established or did not terminate normally. |
Percentage |
|
|
Media failed streams |
Indicates the number of streams where either media path could not be established or did not terminate normally. |
Number |
The detailed diagnosis of this measure lists the Date, hour, first UPN, second UPN, first IP address, second IP address, Conference ID and the total count of media streams that failed. |
|
Streams where media failed due to firewall DPI |
Indicates the number of streams that failed to be established due to the network device blocking access due to deep packet inspection that did not allow traffic from Microsoft Teams. |
Number |
These failures typically indicate a proxy, firewall or other network security device is not correctly configured to access the IP address and ports used by Microsoft Teams in Microsoft 365 or Office 365. The detailed diagnosis of this measure lists the Date, Hour, First IP address, Second IP address, Conference ID and the count of media failures noticed due to firewall DPI. |
|
Streams failed due to other reasons |
Indicates the number of streams where media path could not be established between the endpoints due to an undetermined/unclassified reason. |
Number |
The detailed diagnosis of this measure lists the Date, Hour, First IP address, Second IP address, Conference ID and the total count of media failures noticed due to other reasons. |
|
Firewall DPI media failure percentage |
Indicates the percentage of streams that failed to be established due to network device blocking access due to deep packet inspection that did not allow traffic from Microsoft Teams. |
Percentage |
|
|
Streams where media failed due to firewall IP blockage |
Indicates the number of streams that failed to be established due to network device blocking access to Microsoft Teams servers. |
Number |
These failures typically indicate a proxy, firewall or other network security device is not correctly configured to access the IP address and ports used by Microsoft Teams in Microsoft 365 or Office 365. The detailed diagnosis of this measure lists the Date, Hour, First IP address, Second IP address, Conference ID and total count of media failures noticed due to firewall IP block. |
|
Firewall IP blocked media failure percentage |
Percentage of streams that failed to be established because network equipment blocked access to Microsoft Teams servers. |
Percentage |
These failures typically indicate a proxy, firewall, or other network security device is not correctly configured to access the IP address and ports used by Microsoft Teams in Microsoft 365 or Office 365. |
|
Call setup succeeded streams |
Indicates the number of streams where media path could be established between the endpoints at the start of the call. |
Number |
|
|
Call setup failure percentage |
Indicates the percentage of all streams where media path could not be established between the endpoints at the start of the call. |
Percentage |
|
|
Call setup failed streams |
Indicates the number of streams where media path could not be established between the endpoints at the start of the call. |
Number |
Ideally, the value of this measure should be zero. The detailed diagnosis of this measure lists the Date, hour, First UPN, Second UPN, First IP address, Second IP address, Conference ID and the total streams where media path could not be established between the endpoints. |
|
Call dropped streams |
Indicates the number of streams where media path did not terminate normally. |
Number |
Ideally, the value of this measure should be zero. The detailed diagnosis of this measure lists the Date, Hour, First IP address, Second IP address, first UPN, Second UPN, Conference ID and the total count of call dropped streams. |
|
Call dropped failure percentage |
Indicates the percentage of successfully established streams where media path did not terminate normally. |
Percentage |
A low value is desired for this measure. |
|
CDR available streams |
Indicates the number of streams for which Call Detail Records were available. |
Number |
|
|
Average call duration |
Indicates the average duration of streams. |
Seconds |
|
|
Answer seizure ratio |
Indicates the ratio of calls with duration less than 5 seconds over the total number of calls. |
Percentage |
|
The detailed diagnosis of the Media failed streams measure lists the Date, hour, first UPN, second UPN, first IP address, second IP address, Conference ID and the total count of media streams that failed.
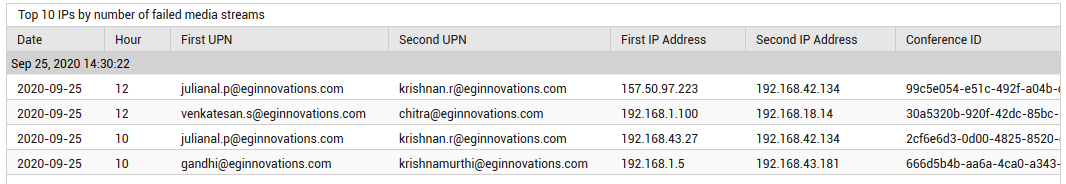
Figure 1 : The detailed diagnosis of the Media failed streams measure
The detailed diagnosis of the Streams failed due to other reasons measure lists the Date, Hour, First IP address, Second IP address, Conference ID and the total count of media failures noticed due to other reasons.
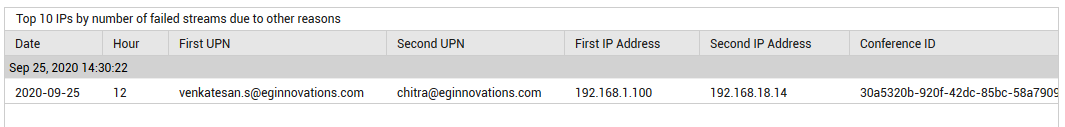
Figure 2 : The detailed diagnosis of the Streams failed due to other reasons measure
The detailed diagnosis of the Call dropped streams measure lists the Date, Hour, First IP address, Second IP address, first UPN, Second UPN, Conference ID and the total count of call dropped streams.
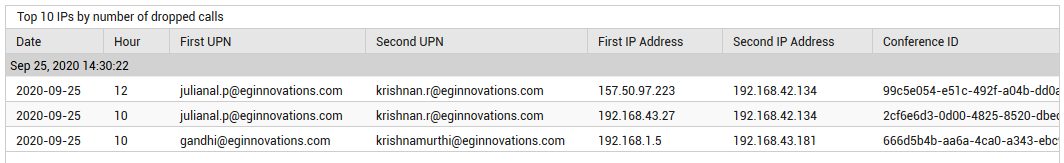
Figure 3 : The detailed diagnosis of the Call dropped streams measure
The detailed diagnosis of the Call setup failed streams measure lists the Date, hour, First UPN, Second UPN, First IP address, Second IP address, Conference ID and the total streams where media path could not be established between the endpoints.
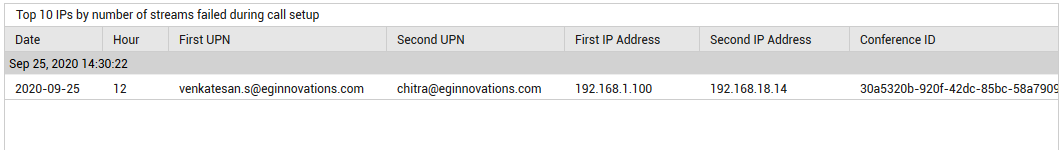
Figure 4 : The detailed diagnosis of the Call setup failed streams measure
The detailed diagnosis of the Streams where media failed due to firewall DPI measure lists the Date, Hour, First IP address, Second IP address, Conference ID and the count of media failures noticed due to firewall DPI.
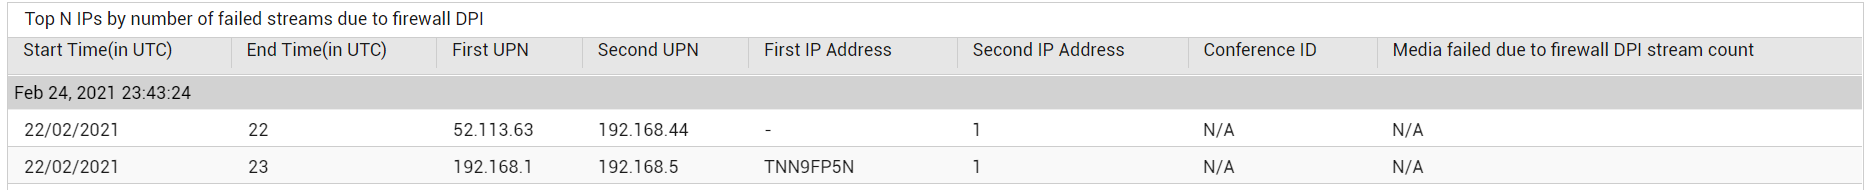
Figure 5 : The detailed diagnosis of the Streams where media failed due to firewall DPI measure
The detailed diagnosis of the Streams where media failed due to firewall IP blockage measure lists the Date, Hour, First IP address, Second IP address, Conference ID and total count of media failures noticed due to firewall IP block.
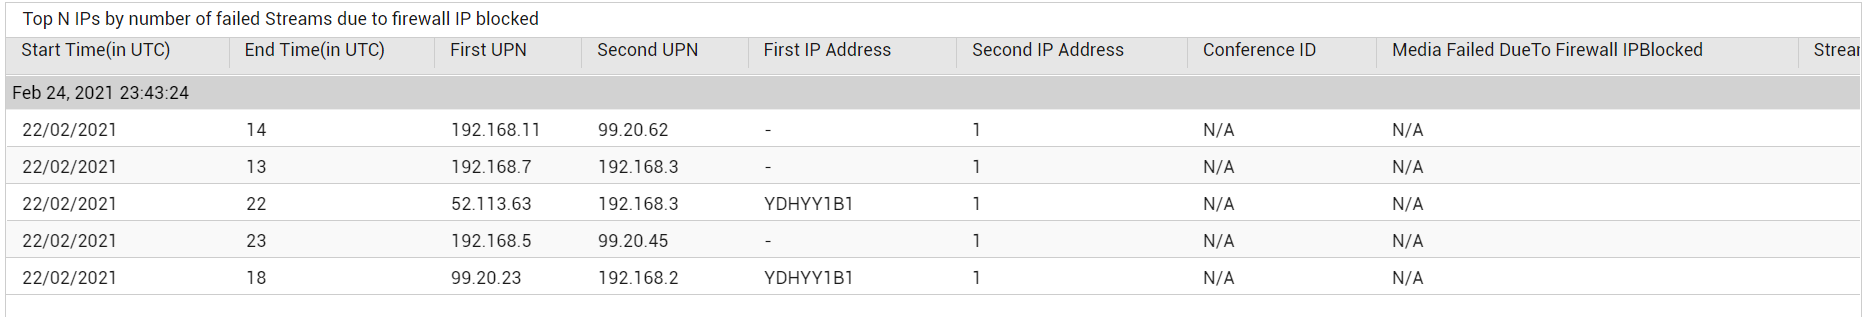
Figure 6 : The detailed diagnosis of the Streams where media failed due to firewall IP blockage measure