Feedback Summary Test
For any organization that tremendously relies on Microsoft Teams for communication among users, it is important to know how users in their organization are using Teams and what their experience is with Teams. User feedback plays a major role in understanding the user experience when using Microsoft Teams. By default, Microsoft Teams uses the terminology endpoint to address the users who initiate/attend calls, chats, meetings etc. The following logic determines which endpoint involved in the stream or call is labeled as first:
-
A Server endpoint (AV MCU, Mediation Server, and so on) is considered First when a Server is involved in the stream or call.
-
A Client endpoint is considered Second unless the stream is between two Server endpoints.
-
If both endpoints are the same type, first vs. second is set based on internal ordering of the user agent category to ensure that the ordering is consistent.
Using the feedback provided by the Microsoft Teams users, administrators can improve the areas (audio/video/calls/screen share) where shorfalls are noticed and thus offer great user experience with respect to Microsoft Teams. The Feedback Summary test helps administrators in this regard!
This test monitors the feedback provided by users on Microsoft Teams and helps administrators determine the count of poor feedback rating provided by the first endpoint user and the second endpoint user. The audio and video issues encountered by the users using the first endpoint and second endpoint helps administrators in identifying the users who are prone to poor audio/video. The overall rating of Microsoft Teams provided by users helps administrators determine the user experience on Microsoft Teams.
Target of the test : Microsoft Teams
Agent deploying the test : A remote agent
Outputs of the test : One set of results for the monitored Microsoft Teams
| Parameters | Description |
|---|---|
|
Test period |
How often should the test be executed |
|
Host |
The host for which the test is to be configured. By default, this is portal.office.com |
|
Tenant Name |
Azure AD certificate-based authentication (CBA) enables customers to allow or require users to authenticate with X.509 certificates against their Azure Active Directory (Azure AD) for applications and browser sign-in. This test requires a valid X.509 certificate, so that it can securely access the target tenant and its resources. For this purpose, you should do the following:
|
|
O365 User Name, O365 Password, and Confirm Password |
For execution, this test requires the privileges of an O365 user who has been assigned the Service support admin role and is vested with the View-Only Audit Logs and Team administrator permission. Configure the credentials of such a user against O365 User Name and O365 Password text boxes. Confirm the password by retyping it in the Confirm Password text box. While you can use the credentials of any existing O365 user with the afore-said privileges, it is recommended that you create a special user for monitoring purposes using the Office 365 portal and use the credentials of that user here. To know how to create a new user using the Office 365 portal and assign the required privileges to that user, refer to Creating a New User in the Office 365 Portal |
|
Domain Name, Domain User Name, Domain Password, and Confirm Password |
These parameters are applicable only if the eG agent needs to communicate with the Office 365 portal via a Proxy server. In this case, in the Domain text box, specify the name of the Windows domain to which the eG agent host belongs. In the Domain User Name text box, mention the name of a valid domain user with login rights to the eG agent host. Provide the password of that user in the Domain Password text box and confirm that password by retyping it in the Confirm Password text box. On the other hand, if the eG agent is not behind a Proxy server, then you need not disturb the default setting of these parameters. By default, these parameters are set to none. |
|
Proxy Host, Proxy Port, Proxy User Name, Proxy Password and Confirm Password |
These parameters are applicable only if the eG agent needs to communicate with the Office 365 portal via a Proxy server. In this case, provide the IP/host name and port number of the Proxy server that the eG agent should use in the Proxy Host and Proxy Port parameters, respectively. If the Proxy server requires authentication, then specify the credentials of a valid Proxy user against the Proxy User Name and Proxy Password text boxes. Confirm that password by retyping it in the Confirm Password text box. If the Proxy server does not require authentication, then specify none against the Proxy User Name, Proxy Password, and Confirm Password text boxes. On the other hand, if the eG agent is not behind a Proxy server, then you need not disturb the default setting of any of the Proxy-related parameters. By default, these parameters are set to none. |
|
Show Top N DD |
By default, this parameter is set to 10, indicating that the detailed diagnostics will report the top-10 data. You can change the 'N' in Show Top N DD by specifying any number of your choice in this text box. |
|
DD Frequency |
Refers to the frequency with which detailed diagnosis measures are to be generated for this test. The default is 1:1. This indicates that, by default, detailed measures will be generated every time the test runs, and also every time the test detects a problem. You can modify this frequency, if you so desire. Also, if you intend to disable the detailed diagnosis capability for this test, you can do so by specifying none against DD Frequency. |
|
Detailed Diagnosis |
To make diagnosis more efficient and accurate, the eG Enterprise embeds an optional detailed diagnostic capability. With this capability, the eG agents can be configured to run detailed, more elaborate tests as and when specific problems are detected. To enable the detailed diagnosis capability of this test for a particular server, choose the On option. To disable the capability, click on the Off option. The option to selectively enabled/disable the detailed diagnosis capability will be available only if the following conditions are fulfilled:
|
| Measurement | Description | Measurement Unit | Interpretation |
|---|---|---|---|
|
Video issues indicated in second feedback tokens |
Indicates the number of streams where user using the second endpoint indicated an issue with video. |
Number |
|
|
Audio issues indicated in second feedback tokens |
Indicates the number of streams where user using the second endpoint indicated an issue with audio. |
Percentage |
The detailed diagnosis of this measure lists the Date, hour, the count of second feedback mentioning audio issues, First IP address, Second IP address and Conference ID. |
|
Percentage of poor rating in second feedback |
Indicates the percentage of streams rated by the user using the second endpoint as either 1 or 2. |
Percentage |
|
|
Poor rating in second feedback |
Indicates the number of streams rated by the user using the second endpoint as either 1 or 2. |
Number |
The detailed diagnosis of this measure lists the Date, hour, Second feedback rating, First IP address, Second IP address and Conference ID. |
|
Avg rating using second endpoint |
Indicates the number of average rating of streams reported by the user using the second endpoint. |
Number |
|
|
Streams rated using the second endpoint |
Indicates the number of streams rated by the user using the second endpoint. |
Number |
|
|
Video issues indicated in first feedback tokens |
Indicates the number of streams where user using the first endpoint indicated an issue with video. |
Number |
|
|
Audio issues indicated in first feedback tokens |
Indicates the number of streams where user using the first endpoint indicated an issue with audio. |
Number |
The detailed diagnosis of this measure lists the Date, hour, the count of first feedback mentioning audio issues, First UPN, Second UPN, First IP address, Second IP address and Conference ID. |
|
Percentage of poor rating in first feedback |
Indicates the percentage of streams rated by the user using the first endpoint as either 1 or 2. |
Percentage |
|
|
Poor rating in first feedback |
Indicates the number of streams rated by the user using the second endpoint as either 1 or 2. |
Number |
The detailed diagnosis of this measure lists the Date, hour, First feedback rating, First UPN, Second UPN, First IP address, Second IP address and Conference ID. |
|
Avg rating using first endpoint |
Indicates the number of average rating of streams reported by the user using the first endpoint. |
Number |
|
|
Streams rated using the first endpoint |
Indicates the number of streams rated by the user using the first endpoint. |
Number |
|
The detailed diagnosis of the Poor rating in first feedback measure lists the Date, hour, First feedback rating, First UPN, Second UPN, First IP address, Second IP address and Conference ID.

Figure 1 : The detailed diagnosis of the Poor rating in first feedback measure
The detailed diagnosis of the Poor rating in second feedback measure lists the Date, hour, Second feedback rating, First IP address, Second IP address and Conference ID.
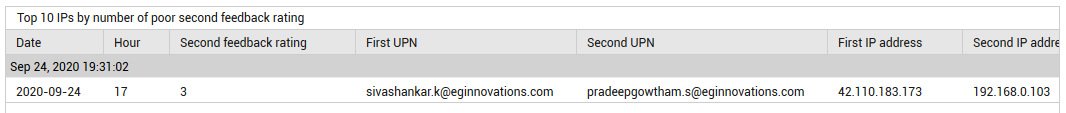
Figure 2 : The detailed diagnosis of the Poor rating in second feedback measure
The detailed diagnosis of the Audio issues indicated in first feedback tokens measure lists the Date, hour, the count of first feedback mentioning audio issues, First UPN, Second UPN, First IP address, Second IP address and Conference ID.

Figure 3 : The detailed diagnosis of the Audio issues indicated in first feedback tokens measure
The detailed diagnosis of the Audio issues indicated in second feedback tokens measure lists the Date, hour, the count of second feedback mentioning audio issues, First IP address, Second IP address and Conference ID.
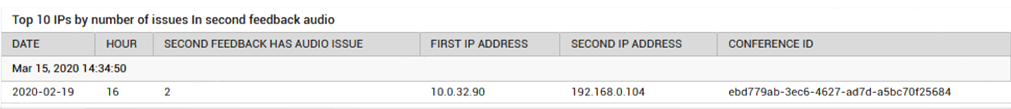
Figure 4 : The detailed diagnosis of the Audio issues indicated in second feedback tokens measure