How to Monitor Solace PubSub+ Event Broker Using eG Enterprise?
Once you fulfilled the pre-requisites for monitoring the Solace PubSub+ Event Broker, follow the broad steps outlined below to manage and then monitor the target broker using eG Enterprise:
- Add an Solace PubSub+ Event Broker component using eG Admin interface
- Configure tests for the managed Solace PubSub+ Event Broker component
These steps are explained in the following sections.
Adding a Solace PubSub+ Event Broker Component
Solace PubSub+ Event Broker cannot be automatically discovered by eG Enterprise. This implies that you will have to manually add an Solace PubSub+ Event Broker component into the eG Enterprise system using eG admin interface. Follow the steps below to achieve the same:
- Login to the eG admin interface.
- Click on the Add Component button in the right corner of the Components at a Glance page that appears or follow the Infrastructure -> Components -> Add/Modify menu sequence.
- The Components page will then appear. In the Components page, select Solace PubSub+ Event Broker as the Component type and click the Add New Component button.
-
Figure 1 will then appear.
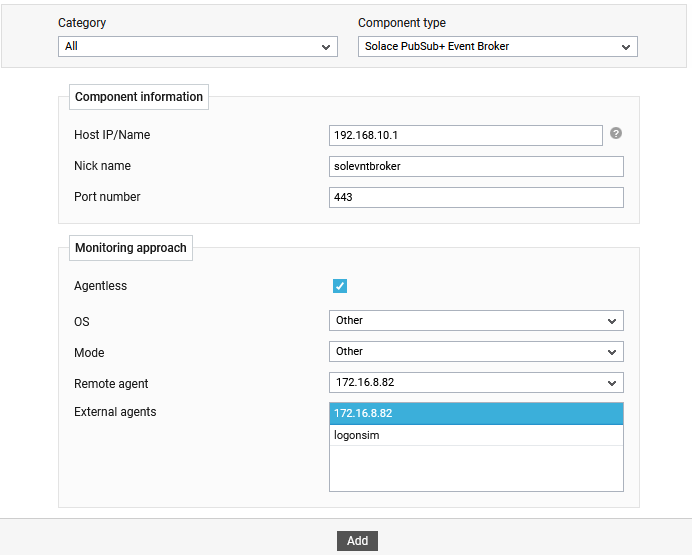
- Specify the Host IP/Name and the Nick name for the Solace PubSub+ Event Broker component in Figure 1. Then, provide a Nick name for the same.
- Next, specify the port number in the Port Number text box.
-
By default, the Solace PubSub+ Event Broker can only be monitored in an agent-less manner. Therefore, select the Agentless check box, then do the following:
- Once the Solace PubSub+ Event Broker component is added successfully, you will be directed to the Components at a Glance page. Using the options provided against the newly added component, you can modify, unmanage or delete the component. In addition, you can also configure the tests, set thresholds and maintenance policies, and change the IP address.
Configuring the tests
To configure the tests mapped to the Solace PubSub+ Event Broker component, click on the Configure tests icon. This will lead you to the Specific Test Configuration page where the list of tests mapped to the target component will be listed as shown in Figure 2.
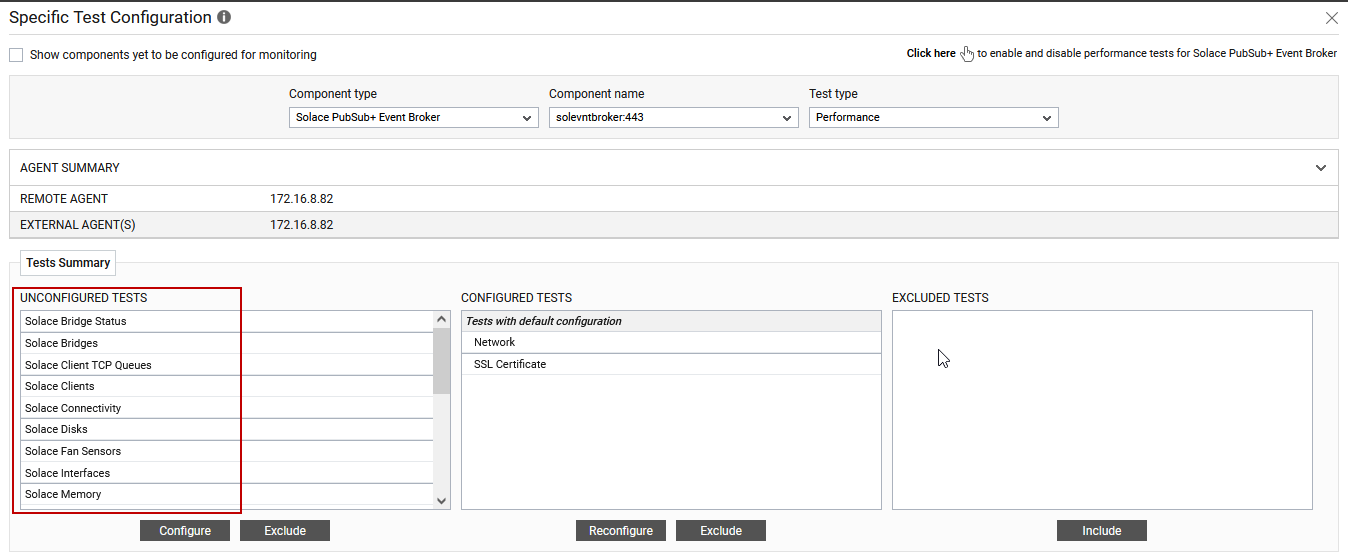
Figure 2 : The list of tests to be configured for the target broker
Click on any of the tests to configure it. For instance, lets say, you want to configure the Solace Bridge Status test. Clicking on the test name in Figure 2 will invoke the parameters to be configured as shown in Figure 3.
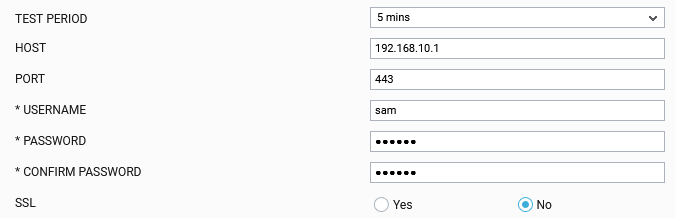
Figure 3 : Configuring the Solace Bridge Status test
To know what parameters this test takes and how to configure it, refer to the Solace Bridge Status Test. Once the test is configured, click the Update button to save the test configuration. Then, switch to Monitor interface to view the metrics reported by the Solace PubSub+ Event Broker component.