Desktop Applications Test
This test discovers the applications executing on the Windows desktops and reports the availability and resource-usage of each of the desktop applications.
Target of the test : A Windows Systems Group
Agent deploying the test : A remote agent
Outputs of the test : One set of outputs for every distinct application executing on the Windows systems.
| Parameter | Description |
|---|---|
|
Test Period |
How often should the test be executed. By default, this parameter is set to 1hr. |
|
Host |
The nick name of the Windows Systems Group component for which this test is to be configured. |
|
Port |
The port at which the specified Host listens. By default, this is NULL. |
|
Inside View Using |
To obtain the 'inside view' of performance of the systems - i.e., to measure the internal performance of the systems - this test uses a light-weight eG VM Agent software deployed on each of the systems. Accordingly, this parameter is by default set to eG VM Agent. |
|
Report By User |
This flag is set to No by default. This implies that the Windows systems in environments will always be identified using the system name. In other words, this test will, by default, report measures for every systemname. On the other hand, if you want this test to report the measures for every user on a system, then set this flag to Yes. In such a case, this test will report the measures for every username_on_systemname. |
|
Report Powered OS |
By default, this flag is set to Yes, then the 'inside view' tests will report measures for even those Windows systems that do not have any users logged in currently. The systems will be identified by their name and not by the username_on_systemname. On the other hand, if this flag is set to No, then this test will not report measures for those systems to which no users are logged in currently. |
|
Is Cloud VMs? |
This flag is set to Yes by default. The value of this flag cannot be changed. This implies that the cloud-based Windows systems in environments will always be identified using the login name of the user. In other words, in cloud environments, this test will, by default, report measures for every username_on_systemname. |
|
Exclude |
Provide a comma-separated list of file patterns to be excluded from monitoring in the Exclude text box. This helps to filter out irrelevant file types that are not essential to the performance analysis of the desktop applications. For example *.vvf,*.pdf,*.jpeg,*.png,*.rbf,*.doc*. |
|
DD Frequency |
Refers to the frequency with which detailed diagnosis measures are to be generated for this test. The default is 1:1. This indicates that, by default, detailed measures will be generated every time this test runs, and also every time the test detects a problem. You can modify this frequency, if you so desire. Also, if you intend to disable the detailed diagnosis capability for this test, you can do so by specifying none against DD FREQUENCY. |
|
Detailed Diagnosis |
To make diagnosis more efficient and accurate, eG Enterprise embeds an optional detailed diagnostic capability. With this capability, the eG agents can be configured to run detailed, more elaborate tests as and when specific problems are detected. To enable the detailed diagnosis capability of this test for a particular server, choose the On option. To disable the capability, click on the Off option. The option to selectively enable/disable the detailed diagnosis capability will be available only if the following conditions are fulfilled:
|
| Measurement | Description | Measurement Unit | Interpretation |
|---|---|---|---|
|
Processes running |
Indicates the number of instances of this application that is currently executing across all desktops on the target host operating system. |
Number |
|
|
Physical CPU usage |
Indicates the percentage of physical CPU resources utilized by this application. |
Percent |
A very high value of this measure is a cause for concern, as it indicates excessive CPU usage by a single application. This in turn would cause other desktop applications to contend for limited physical resources, thus degrading the performance of those applications and that of the server as a whole. If this measure reports a value close to 100% for any application, then you can use the detailed diagnosis of this measure to identify which specific instance of that application is hogging CPU. |
|
Memory usage |
Indicates the amount of physical memory resources utilized by this application. |
MB |
A very high value of this measure is a cause for concern, as it indicates excessive memory usage by a single application. This in turn would cause other desktop applications to contend for limited physical memory resources, thus degrading the performance of those applications and that of the server as a whole. If this measure reports a high for any application, then you can use the detailed diagnosis of this measure to identify which specific instance of that application is hogging memory. |
|
CPU used |
Indicates the physical CPU (in Mhz) used up by this application. |
Mhz |
|
|
I/O reads |
Indicates the rate at which this application reads data from the disk. |
KB/Sec |
Compare the value of these measures across applications to identify the I/O-intensive application. |
|
I/O writes |
Indicates the rate at which this application writes data to the disk. |
KB/Sec |
|
|
I/O read operations |
Indicates the rate at which this application performs read operations. |
Operations/Sec |
Compare the value of these measures across applications to identify the I/O-intensive application. |
|
I/O write operations |
Indicates the rate at which this application performs write operations. |
Operations/Sec |
|
|
Total I/O operations |
Indicates the rate at which this application performs I/O operations. |
Operations/Sec |
|
|
Percent of memory usage |
Indicates the percentage of memory used by this application. |
Percent |
A high value for this measure indicates that the application is consuming more memory. This is a cause for concern. |
The detailed diagnosis of the Physical CPU usage and Memory usage measures list all the running instances of the given application, and reports the CPU and memory usage of each instance. From these insights, you can accurately isolate the instance that is consuming CPU and/or memory resources excessively.
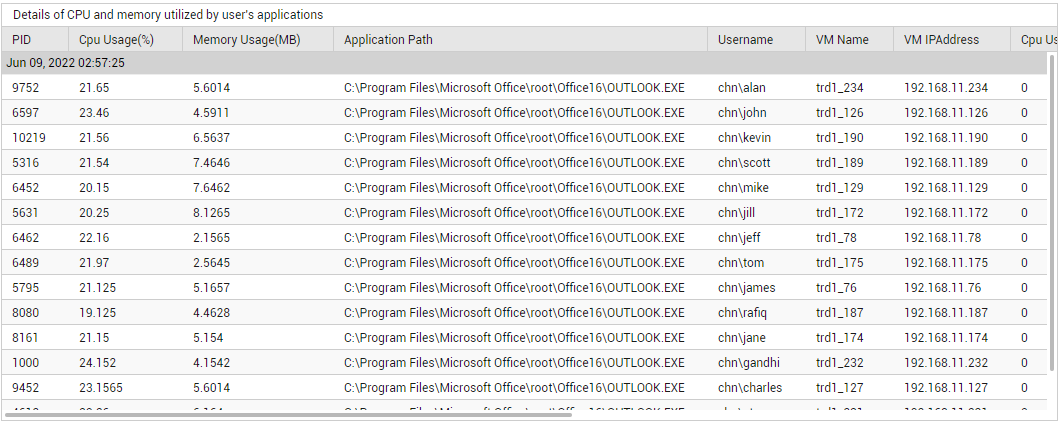
Figure 1 : The detailed diagnosis of the Physical CPU usage measure of the Desktop Applications test