eG Trend Log Test
You can closely track the status of the trend computation process by enabling logging for that process using the manager settings page (Configure -> Manager Settings menu sequence) in the eG administrative interface. This will result in the creation of the trend_log file (in the <EG_INSTALL_DOR>\manager\logs directory), to which the status and errors pertaining to the trend-related activities will be logged as and when they occur.
This test monitors the trend_log for errors and provides the complete details of these errors to simplify troubleshooting.
Target of the test : The eG Manager
Agent deploying the test : An internal agent
Outputs of the test : One set of results for critical eG manager function.
| Parameter | Description |
|---|---|
|
Test period |
How often should the test be executed . |
|
Host |
The host for which the test is to be configured. |
|
Port |
The port number at which the specified host listens. |
|
AlertFile |
Specify the full path to the log file to be monitored. Since the trend_log is by default found in the <EG_INSTALL_DIR>\manager\logs directory, the same is displayed here by default. Also, instead of a specific log file path, the path to the directory containing the trend_log files can be provided - eg., /opt/egurkha/manager/logs. This ensures that eG Enterprise monitors the most recent log files in the specified directory. Specific log file name patterns can also be specified. For example, to monitor the latest log files with names containing the string trend_log, the parameter specification can be, /opt/egurkha/manager/*trend_log*. Here, '*' indicates leading/trailing characters (as the case may be). In this case, the eG agent first enumerates all the log files in the specified path that match the given pattern, and then picks only the latest log file from the result set for monitoring. Every time this test is executed, the eG agent verifies the following:
|
|
SearchPattern |
Enter the specific patterns of alerts to be monitored. The pattern should be in the following format: <PatternName>:<Pattern>, where <PatternName> is the pattern name that will be displayed in the monitor interface and <Pattern> is an expression of the form - *expr* or expr or *expr or expr*, etc. A leading '*' signifies any number of leading characters, while a trailing '*' signifies any number of trailing characters. Multiple search patterns can be specified as a comma-separated list. If you want all the messages in a log file to be monitored, then your specification would be: <PatternName>:*. By default, this test monitors error and warning events logged in the trend_log file. Therefore, the default SearchPattern is set as: error:*ERROR*,warn:*WARN*. This indicates that by default, the test will monitor only those lines in the trend_log which embed the strings ERROR and WARN. |
|
Lines |
Specify two numbers in the format x:y. This means that when a line in the alert file matches a particular pattern, then x lines before the matched line and y lines after the matched line will be reported in the detail diagnosis output (in addition to the matched line). The default value here is 0:0. Multiple entries can be provided as a comma-separated list. If you give 1:1 as the value for Lines, then this value will be applied to all the patterns specified in the SearchPattern field. If you give 0:0,1:1,2:1 as the value for Lines and if the corresponding value in the SearchPattern filed is like ORA:ORA-*,offline:*offline*,online:*online then: 0:0 will be applied to ORA:ORA-* pattern 1:1 will be applied to offline:*offline* pattern 2:1 will be applied to online:*online pattern |
|
ExcludePattern |
Provide a comma-separated list of patterns to be excluded from monitoring in the ExcludePattern text box. For example *critical*, *exception*. By default, this parameter is set to 'none'. |
|
UniqueMatch |
By default, the UniqueMatch parameter is set to False, indicating that, by default, the test checks every line in the log file for the existence of each of the configured SearchPattern. By setting this parameter to True, you can instruct the test to ignore a line and move to the next as soon as a match for one of the configured patterns is found in that line. For example, assume that Pattern1:*fatal*,Pattern2:*error* is the SearchPattern that has been configured. If UniqueMatch is set to False, then the test will read every line in the log file completely to check for the existence of messages embedding the strings 'fatal' and 'error'. If both the patterns are detected in the same line, then the number of matches will be incremented by 2. On the other hand, if UniqueMatch is set to True, then the test will read a line only until a match for one of the configured patterns is found and not both. This means that even if the strings 'fatal' and 'error' follow one another in the same line, the test will consider only the first match and not the next. The match count in this case will therefore be incremented by only 1. |
|
RotatingFile |
This flag governs the display of descriptors for this test in the eG monitoring console. This flag is set to False by default. In this case, the descriptors of the test will be of the following format: <Alert_file_name>:<SearchPattern>. If this flag is set to True and the AlertFile text box contains the full path to a specific (log/text) file, then, the descriptors of this test will be displayed in the following format: Directory_containing_monitored_file:<SearchPattern>. Since the AlertFile parameter is set to /manager/logs/trend_log by default in the case of this test, setting the RotatingFile to true will display descriptors in the following format in the eG monitoring console: /manager/logs/trend_log:<SearchPattern>. On the other hand, if this flag is set to True and the AlertFile parameter is set to the directory containing log files (say, /manager/logs), then, the descriptors of this test will be displayed in the format: Configured_directory_path:<SearchPattern> - i.e., /manager/logs:<SearchPattern>. On the other hand, if the RotatingFile parameter had been set to false, then the descriptors will be of the following format: Configured_directory:<SearchPattern> - i.e., logs:<SearchPattern> in the case of the example above. If this flag is set to True and the AlertFile parameter is set to a specific file pattern, then, the descriptors of this test will be of the following format: <FilePattern>:<SearchPattern>. /opt/egurkha/manager/*trend_log*, and rotatingfile is set to True, then, your descriptor will be: *trend_log*:<SearchPattern>. In this case, the descriptor format will not change even if the RotatingFile flag status is changed . |
|
CaseSensitive |
This flag is set to No by default. This indicates that the test functions in a 'case-insensitive' manner by default. This implies that, by default, the test ignores the case of your AlertFile and SearchPattern specifications. If this flag is set to Yes on the other hand, then the test will function in a 'case-sensitive' manner. In this case therefore, for the test to work, even the case of your AlertFile and SearchPattern specifications should match with the actual. |
|
OverwrittenFile |
By default, this flag is set to False. Set this flag to true if you want the test to support the 'roll over' capability of the specified AlertFile. A roll over typically occurs when the timestamp of a file changes or when the log file size crosses a pre-determined threshold. When a log file rolls over, the errors/warnings that pre-exist in that file will be automatically copied to a new file, and all errors/warnings that are captured subsequently will be logged in the original/old file. For instance, say, errors and warnings were originally logged to a file named trend_log. When a roll over occurs, the content of the file trend_log will be copied to a file named trend_log.1, and all new errors/warnings will be logged trend_log. In such a scenario, since the overwrittenfile flag is set to false by default, the test by default scans only trend_log.1 for new log entries and ignores trend_log. On the other hand, if the flag is set to true, then the test will scan both trend_log and trend_log.1 for new entries. If you want this test to support the 'roll over' capability described above, the following conditions need to be fulfilled:
|
|
DD Frequency |
Refers to the frequency with which detailed diagnosis measures are to be generated for this test. The default is 1:1. This indicates that, by default, detailed measures will be generated every time this test runs, and also every time the test detects a problem. You can modify this frequency, if you so desire. Also, if you intend to disable the detailed diagnosis capability for this test, you can do so by specifying none against DD frequency. |
|
Detailed Diagnosis |
To make diagnosis more efficient and accurate, the eG Enterprise embeds an optional detailed diagnostic capability. With this capability, the eG agents can be configured to run detailed, more elaborate tests as and when specific problems are detected. To enable the detailed diagnosis capability of this test for a particular server, choose the On option. To disable the capability, click on the Off option. The option to selectively enable/disable the detailed diagnosis capability will be available only if the following conditions are fulfilled:
|
| Measurement | Description | Measurement Unit | Interpretation |
|---|---|---|---|
|
Recent messages |
Indicates the number of messages matching the specified SearchPattern that were recently logged in the specified AlertFile. |
Number |
The detailed diagnosis of this measure sheds light on the nature of errors that occurred when trends were computed. |
The detailed diagnosis of the Recent messages measure provides the complete details of the errors logged in the trend_log file.
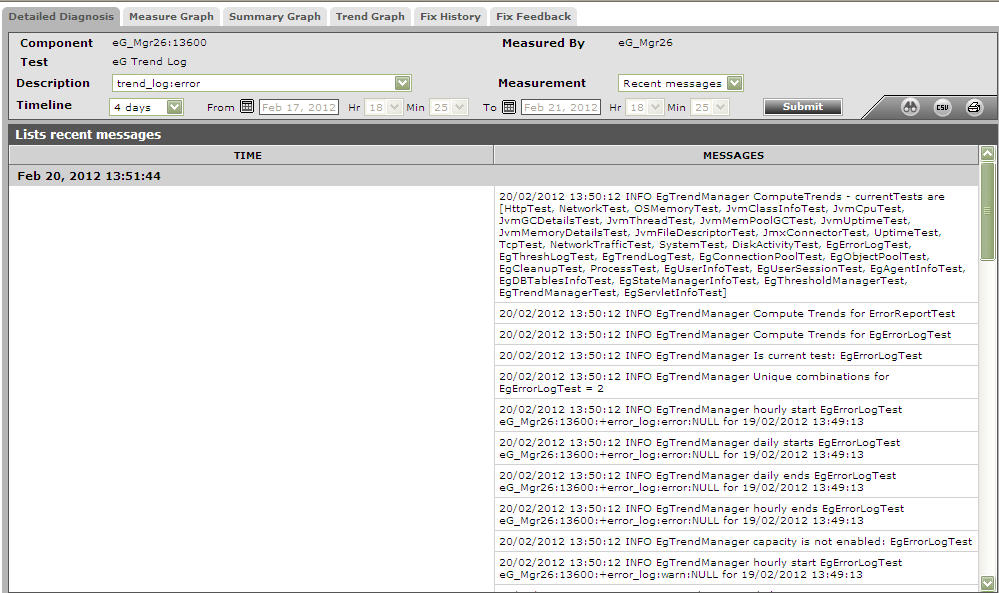
Figure 4 : The detailed diagnosis of the Recent messages measure of the eG Trend Log test