New Dashboards for AWS Services
This is just a quick blog to draw attention to some new and enhanced monitoring dashboards we have added to eG Enterprise in the upcoming release (v 7.2) to provide quick and powerful overviews of a range of AWS services.
As with all our dashboards, color-coded overlays provide guided drilldown for help desk operators and administrators. If a component has an issue, an amber or red indicator is overlaid to allow the viewer to click through to further diagnostic information.
Dashboards can be published for external viewers to provide an overview of service status and TV / Kiosk mode allows dashboards to be published to information screens, a feature often used in IT help desk centers.
Importantly, these new dashboards combine credit, billing and costing information alongside key performance metrics such as CPU, RAM, latency, IOPs and so on. This ensures that costs can be understood and optimized even when using burstable EC2 instances and other instance family types.
AWS Monitoring Dashboards for EC2
EC2 is one of the most popular AWS services. For a list of top 10 AWS services, see our earlier blog on this topic. With the new EC2 monitoring dashboard, you can get an at-a-glance view of your EC2 usage.
Select the AWS account of interest and see:
- What percentage of your EC2 instances are healthy?
- What is the current spend on EC2 instances?
- How many VMs are powered off?
- What instance types are you using?
- Have there been new instances added/removed?
- Which region are your instances located in?
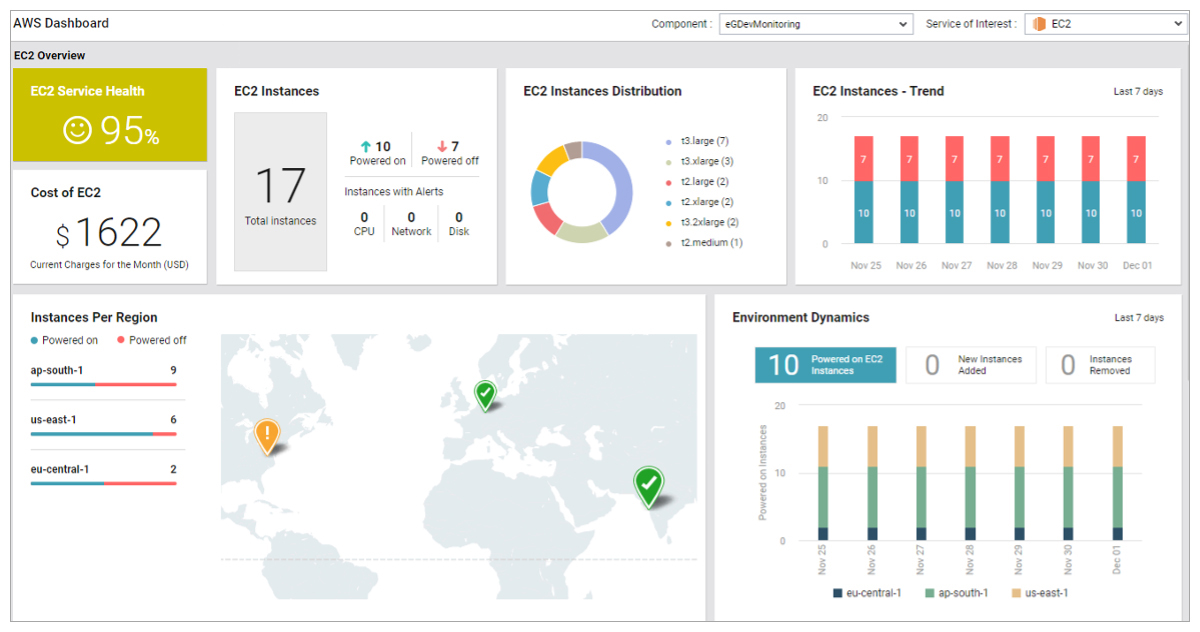
Change the “Component” selection in the above figure and see statistics for another AWS account. Yes, eG Enterprise makes it simple for you to analyze usage and performance across different AWS accounts.
With the EC2 dashboard, you also get a quick overview of your EC2 instance utilization levels. You may have hundreds of instances running. This dashboard gives you a quick idea of the most utilized regions and instances based on key AWS EC2 metrics including CPU Utilization, Network Throughput, Disk IOPs, CPU Credit Balance, IO Credit Balance and Throughput Credit Balance.
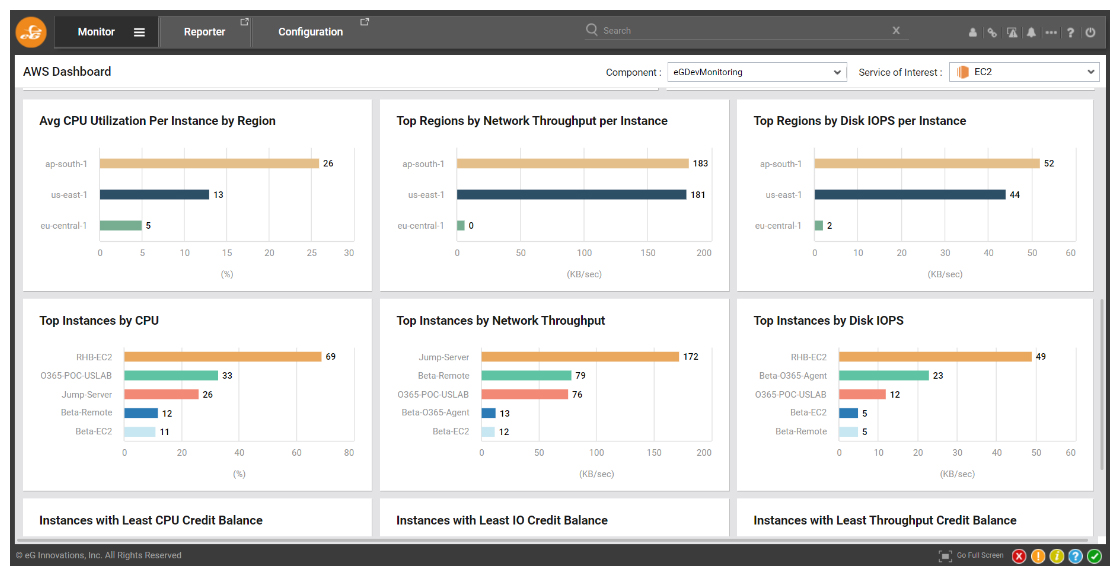
 | The choice of EC2 instance can greatly impact your performance, costs and the end-user experience, a recent article covers a case study of how eG Enterprise can help you understand and troubleshoot EC2 instance issues, see: Select the right AWS EC2 instance type for optimal monitoring (eginnovations.com). |
AWS Monitoring Dashboards for EBS
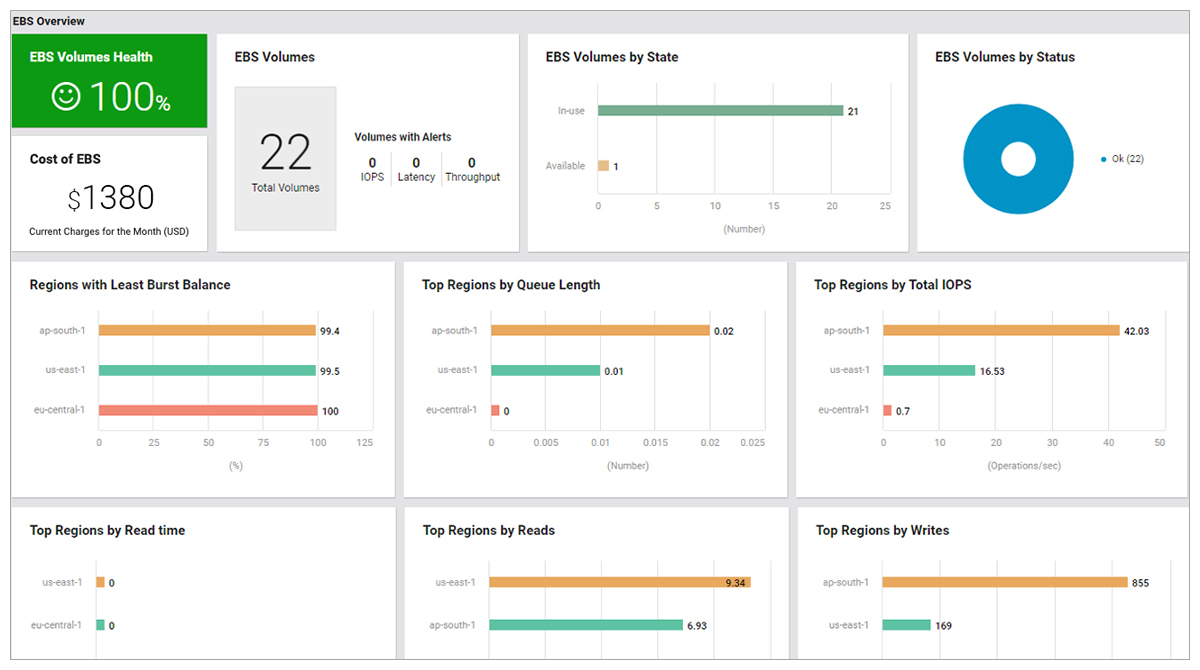
Even if EC2 instances are performing well, if the EBS volumes they use have bottlenecks, end user performance can be impacted. Therefore, it is important to track the utilization and performance of EBS volumes. The EBS dashboard answers questions such as:
- What percentage of your EBS volumes are healthy?
- What is the current spend on EBS?
- How many EBS volumes are there and are there alerts pertaining to these volumes?
- How many EBS volumes are still available for allocation?
- Which region has the highest EBS activity by reads and writes?
- Which regions have the least burst balance?
Within each region, you can also drilldown and see EBS volumes in that region by reads, writes, burst balance, queue length, etc.
While these dashboards provide live insights into performance, other eG Enterprise dashboards and reports can be used to analyze EBS volume performance and utilization over time.
These rich, comprehensive, easy to understand dashboards are available out-of-the-box and provide comparisons across your entire deployment and the overall health and usage of EBS can be understood across the whole organization.

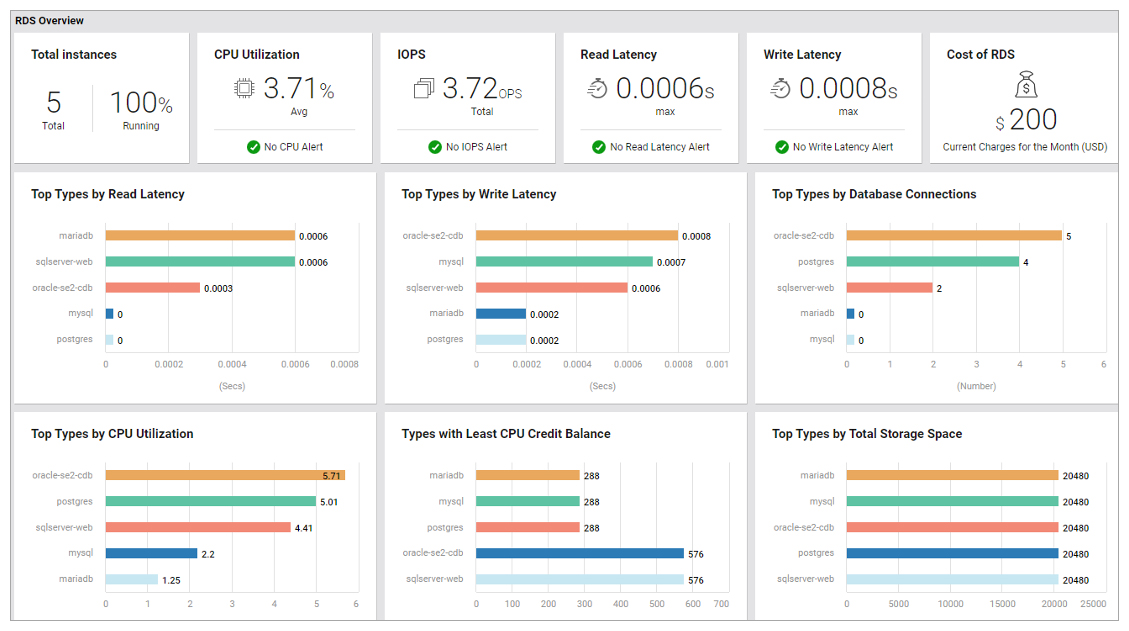
AWS Monitoring Dashboards for RDS
Relational Database Service (RDS) is another key service offering from AWS. With this PaaS offering, customers have access to different database services including Oracle, MySQL, Postgres, Microsoft SQL Server, MariaDB and others. Using AWS CloudWatch APIs, eG Enterprise tracks the status and utilization of different RDS services.
eG Enterprise’s RDS dashboard provides an at-a-glance view of your RDS services health, performance and cost. You can track:
- How many RDS instances are there and how many are running?
- What is the average CPU utilization of your RDS instances?
- What is the overall RDS cost for the month?
- What are the database types with highest read latency and write latency (which of course means those are the database types you need to focus on for optimizing performance)?
- Which database types have the least CPU credit balance (i.e., you may need to look at adding CPU resources to)?
You can drilldown from the dashboard in the figure below by clicking on a type of database and get further insights into the database services with highest latency, least CPU balance, highest storage space and so on.
Of course, if you need to understand why a specific database instance is taking high CPU or has a lot of IOPS, eG Enterprise has in-depth database monitoring capabilities that can be deployed in an agentless manner. Using these capabilities, you can see if there are any long running queries, which queries are causing a lot of IOPS or taking a lot of CPU cycles and so on.
| Those considering the choice between hosting a database on EC2 vs. Using AWS RDS may find our guide: AWS RDS vs EC2: How to choose the right hosted database (eginnovations.com) useful. This provides some insights into the type of monitoring available for each option. |

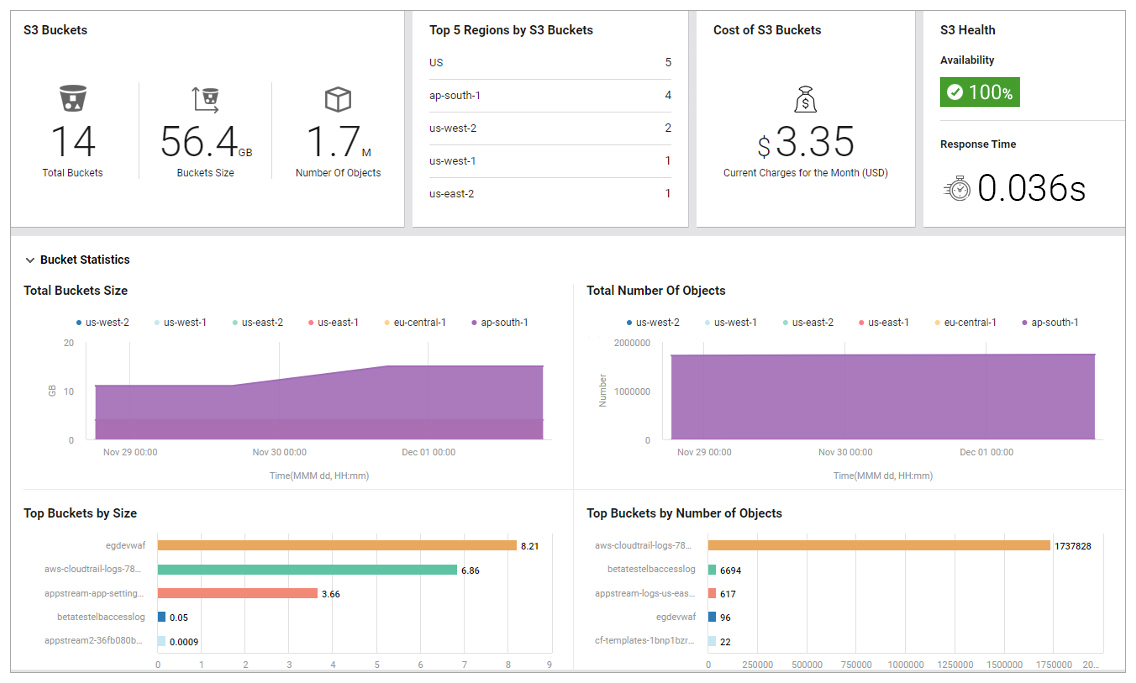
AWS Monitoring Dashboard for S3
Organizations using S3 buckets may want to keep track of the total number of buckets, bucket size, number of objects, which regions they are in, see which buckets have most objects and which are the biggest buckets based on size. The new AWS S3 dashboard provides insights into all aspects of AWS S3 usage and performance.
In addition to these out-of-the-box dashboards, eG Enterprise includes templates for one-click dashboards plus a full GUI editor to create customized dashboards and a dashboard builder equipped with a wealth of widgets to customize and build any dashboard you need.
What does eG Enterprise offer beyond AWS CloudWatch?
The dashboards we have discussed are just a few of the many benefits you can get from using a dedicated AIOps observability platform such as eG Enterprise to complement the native AWS CloudWatch capabilities. eG Enterprise adds value in several areas:
eG Enterprise is an Observability solution for Modern IT. Monitor digital workspaces,
web applications, SaaS services, cloud and containers from a single pane of glass.
- The ability to provide a single web console to monitor AWS services as well as other cloud services (such as Alibaba or Microsoft Azure) and to include on-premises infrastructure services as well and thereby support modern hybrid-cloud and multi-cloud use cases.
- There is no need to train or recruit staff to build custom dashboards, scripts or edit configuration files bespoke to AWS.
- You get active dashboards with full drill downs to understand alerts and issues displayed on dashboards easy and comprehensive enough for frontline help desk use cases.
- eG Enterprise also provides a full suite of synthetic monitoring tools to monitor end-to-end the user experience, performance and availability of key applications and services you deliver via your AWS infrastructure.
- For further information on feature specifications of eG Enterprise vs. CloudWatch, please see: CloudWatch vs eG Enterprise – an AWS CloudWatch Alternative.
eG Enterprise is an Observability solution for Modern IT. Monitor digital workspaces,
web applications, SaaS services, cloud and containers from a single pane of glass.
Related Reading
- An overview of several recent dashboard features and how they can be leveraged to personalize and improve the administrator’s or help desk user’s experience New IT Monitoring Dashboards and Features (eginnovations.com)
- Learn about comprehensive AWS Monitoring in AWS Monitoring: Application and Infrastructure Monitoring
- For digital workspace users: AWS Monitoring Tool for Amazon Workspaces and AWS AppStream Monitoring & Troubleshooting may be of interest, along with Synthetic Monitoring of Amazon Workspaces | eG Innovations
- Select the right AWS EC2 instance type for optimal monitoring (eginnovations.com)
- AWS Cloud Monitoring Explained: What, Why, and How | eG Innovations