Configuration Management and Change Tracking are well known key tenets of project management. Change tracking and controlled change ensure that there is a record of the state of a system and if issues arise the cause can be linked to effects. In this blog, I will use a real-world example to demonstrate the importance of configuration and change tracking when it comes to IT observability.
Over the last few years, as vendors of Application Performance Monitoring (APM) and Observability solutions have been looking to expand their coverage and scope, they have looked at integration with security requirements of organizations. Vendors like DataDog, Dynatrace, NewRelic and others now have security monitoring offerings as well in their portfolio.
Focus on Integrating Security and Observability
“APM tools and agents are already deployed across the most critical applications inside large enterprises. Expanding APM’s capabilities to identify exploitable vulnerabilities in deployed applications and, ideally, block them, seems a promising additional set of capabilities.
Although it is unlikely that we will see an application performance and security monitoring market emerge, the growing overlap and similarity of the IT operations and security operations toolchains, cohorts and strategies suggest that more collaboration is inevitable.”
Gartner Magic Quadrant for Application Performance Monitoring and Observability, June 2022
In contrast to security monitoring, configuration and change tracking, which is another field related to APM and observability, has had little attention. Very few products include configuration and change tracking capabilities. In this blog, we will present a real-world example that highlights how configuration and change tracking can go a long way towards accurate and quick root-cause diagnosis and performance problem rectification.
Siloed IT Organizations Pose Observability Challenges
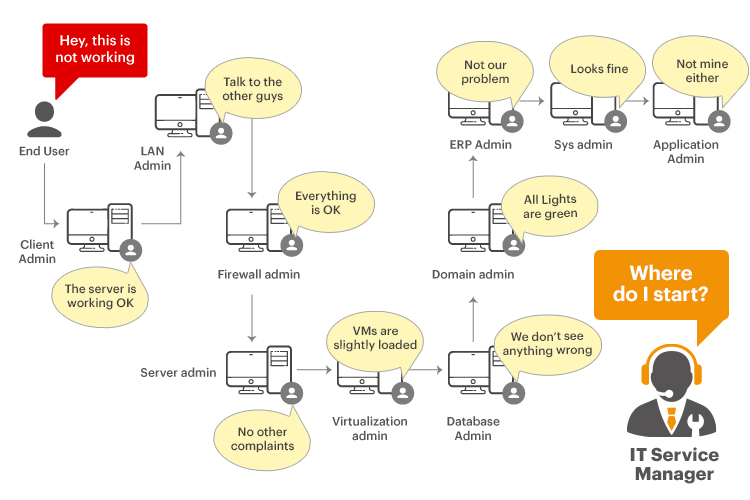
In many organizations, multiple IT teams operate with specific remits and often in a siloed manner. An application team is responsible for developing applications, an application operations team is responsible for maintaining, updating and delivering applications, while an infrastructure team usually takes responsibility for the provisioning of the cloud or on-premises infrastructure on which the applications run. There may be additional middleware, database, identity management teams as well. Additionally, there is often a security team, either within or independent of the infrastructure team, that is responsible for detecting and addressing security vulnerabilities in the infrastructure and the applications used. Often, each of these teams uses a different toolset for their tasks and there is no shared, common view and this makes problem diagnosis challenging and time consuming (see Figure 1).
Configuration and Change Tracking is Especially Important When you Have Silos
When a problem happens, it is often extremely difficult to determine what caused the problem. Some of the many questions that have to be answered include:
- Was a new update applied to the application?
- Did any configuration of the application change?
- Has the application workload changed?
- Is there a security attack going on?
- Has the network performance change?
- Did the database become slower?
- Did we hit a capacity limit in the cloud instance?
Often, the immediate answer from the different IT teams is that they did not cause the problem and the IT service owner is then left with the thankless job of triaging the problem and determining the root-cause. As you will see in our example, keeping track of configurations at the system and application levels and knowing when something changed and having proof of what changed can go a long way in ensuring faster resolution of problems, lower MTTR and improved operational efficiency.

The Problem: Abnormal Application Performance
In our example, on one Monday morning, an IT service owner in a US organization (located in Eastern time zone) received a proactive alert that their application servers were unusually busy. CPU utilization had increased. Many of their business-critical application servers exhibited the issue and so this had to be attended to immediately. The servers were running a heterogeneous mix of Java application servers.
Since the application servers were involved in the problem, the app development team based in Europe was pulled in to investigate the issue. The graphics shown in this blog are a result of the eG Innovations support team working with the app development team to identify the cause of the issue. All times on the charts below are in UTC.
Also, over the weekend, system maintenance had been performed and all the servers had been rebooted.
Step 1 – Confirm Increased Server CPU Utilization Levels
This was easy. The eG Enterprise alarm history showed many alerts relating to high CPU usage on the JVMs hosting the affected applications (see Figure 2).
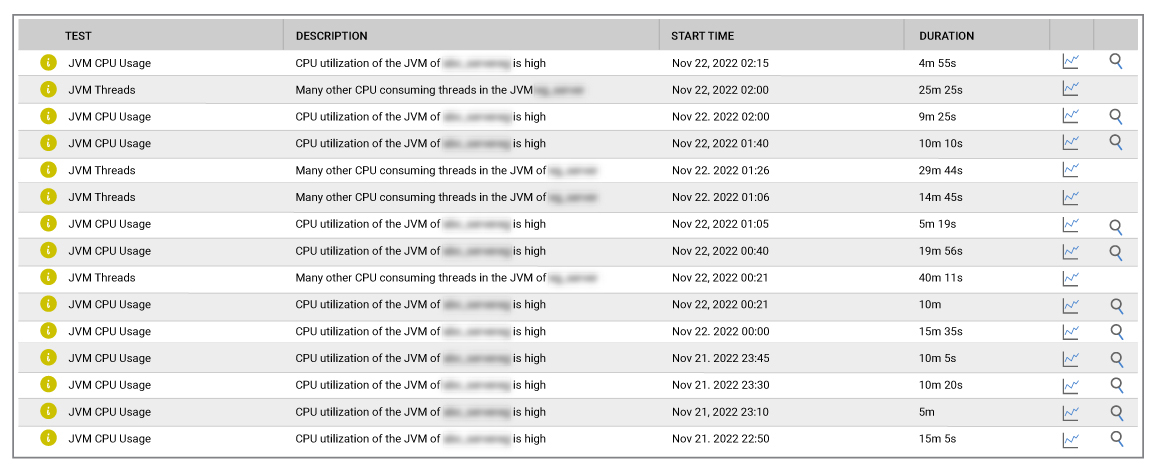
The alarms also confirmed that the CPU issue was not just server related. The key applications and their JVMs were the ones causing the CPU spike.
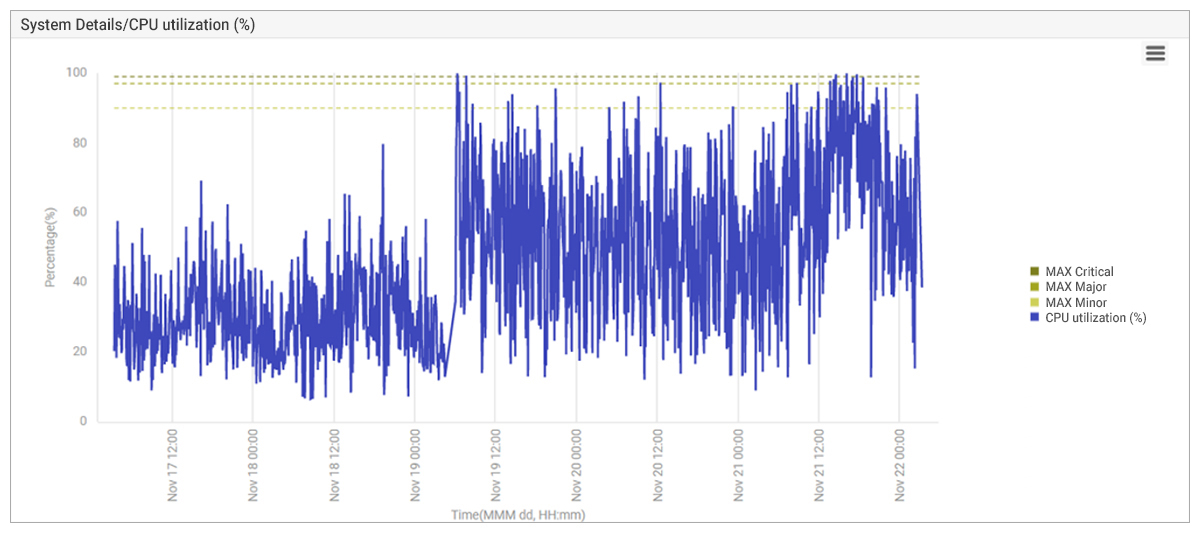
From an analysis of the CPU utilization on the servers, it was clear that just before noon UTC on 19th November, the problem had started and CPU utilization (%) of the servers was close to double that of historical normal usage (see Figure 3).
Since most of the CPU was being utilized by the applications, the finger of suspicion pointed to the application team. But these applications had been working well for over a year and no update, patch or code change had been applied to the application recently.
So, what had caused the problem and how to resolve it?
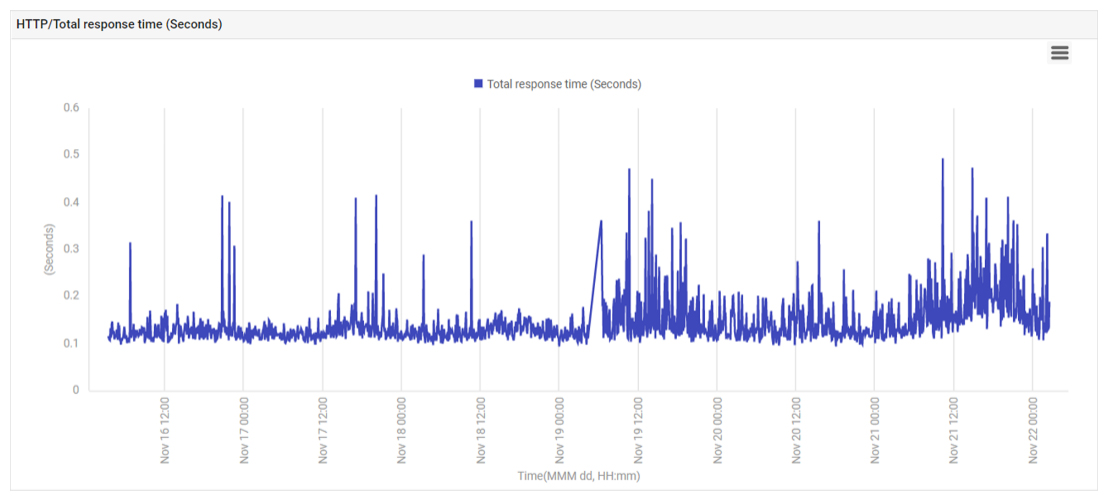
Thankfully, the increased CPU utilization did not result in a significant increase in application response time. Figure 4 below shows the application response time as measured by a synthetic check of application performance. While there was a slight increase in application response and many spikes were seen, the overall increase was not significant enough to cause user complaints. So, the IT operations team was in a proactive investigative mode!
Step 2 – Eliminate if Demand or Malicious DoS Type Attacks are the Cause
Network traffic to and from the servers and TCP connection rates to/from the servers were analyzed to determine if any abnormalities were seen. Figure 5 below shows incoming and outgoing traffic from a server’s network interface.
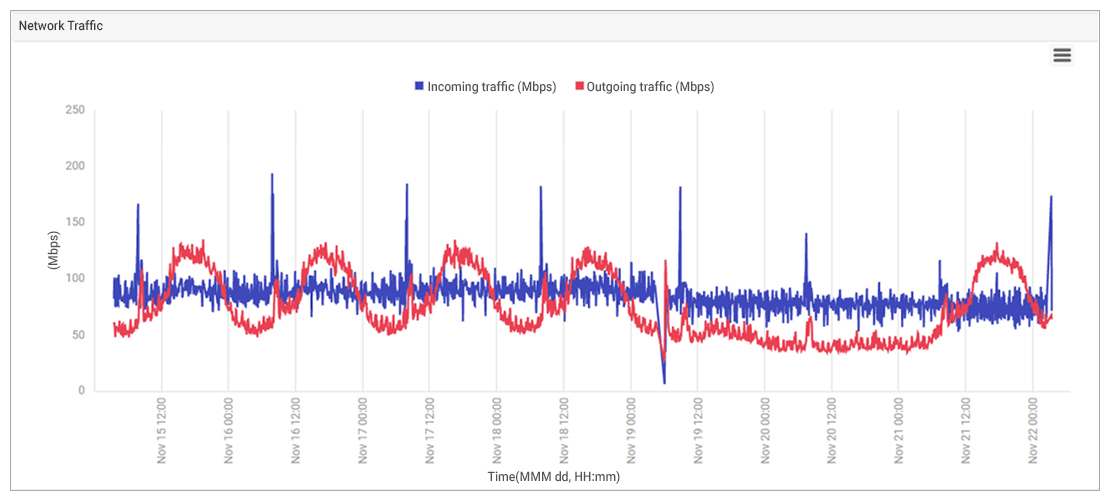
Examining the network traffic showed that there was no unusual demand on the systems and the issue wasn’t caused by a surge in demand. The network traffic clearly shows the regular periodic daily loads on weekdays, then minimal demand over the weekend, followed by a return to regular weekday demand. The sudden dip on 19th was because the systems had been rebooted then.
Step 3 – Verify the Affected Applications
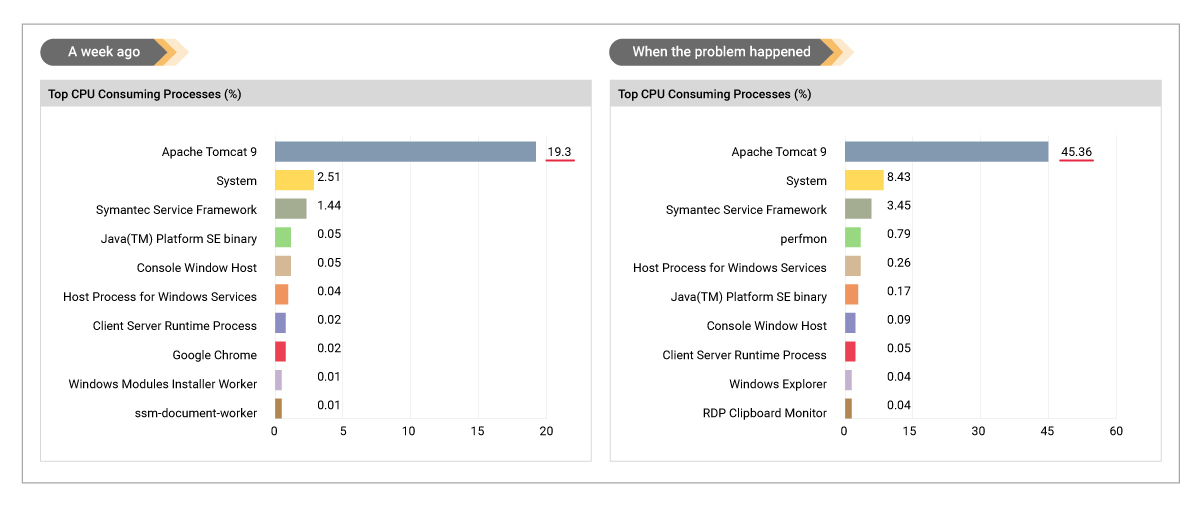
Figure 6 compares the top CPU consuming applications a week earlier and now, when there was a problem. Even though System CPU usage had increased, the majority of the CPU increase was associated with the Apache Tomcat application server on which the business applications were hosted. As you can see from Figure 6, CPU usage of Tomcat had more than doubled.
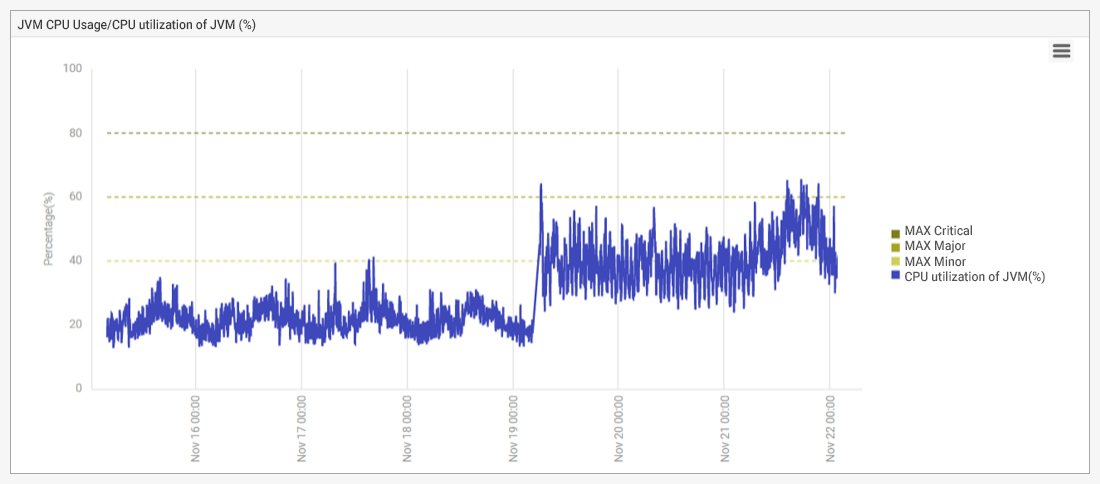
Historical analysis of CPU usage of the Apache Tomcat JVM confirmed that CPU usage had increased over the weekend following the system reboot – see Figure 7. But then, how could the reboot of a system cause increased CPU usage of an application? Over the last year, the systems had been rebooted several times and no similar issues had been seen. So, what was different this time?

Step 4 – Eliminate Common Causes of JVM Issues
JVM CPU usage is often an effect of a problem, not the cause. Endless loops in the application code can cause CPU issues. Analysis of the application stack trace captured using eG Enterprise APM (not shown here) did not provide any application insight. All the application threads seemed to be taking more CPU than normal, but the reason for this could not be explained.
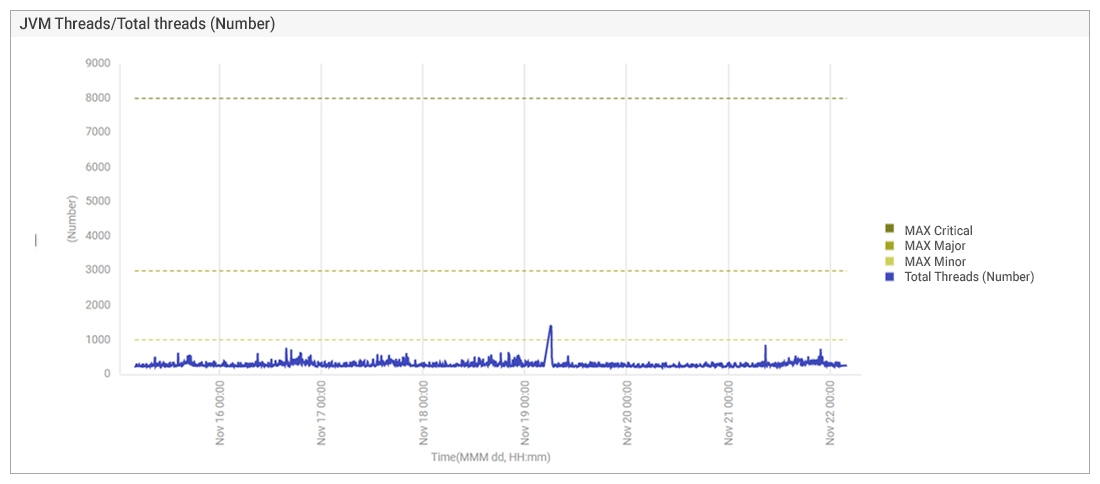
Figure 8 shows the total number of threads in the JVM. Usually, if CPU usage is high, the application spawns more threads to accommodate incoming workloads. This was not happening here, so there was no sign of an application bottleneck.
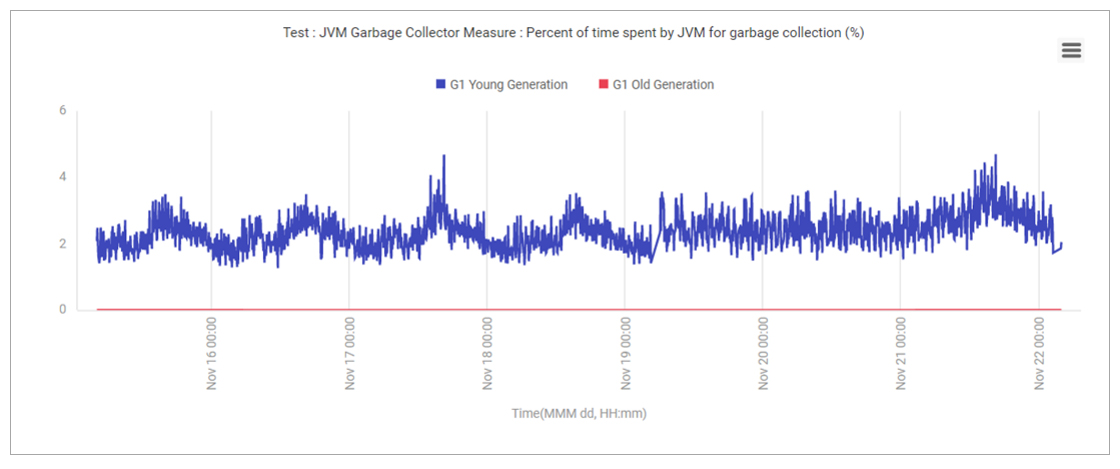
Garbage collection issues in the JVM (e.g., excessive creation/destruction of objects) can lead to increased CPU usage. So, garbage connection activity of the JVM was analyzed – see Figure 9 – and no unusual behaviour was noticed.
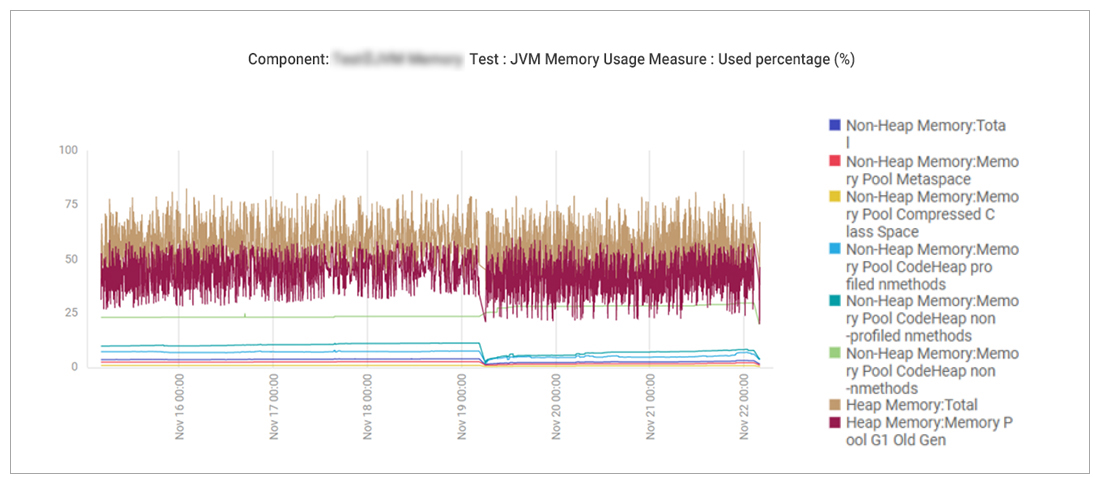
Sometimes, insufficient Java heap memory can also result in higher CPU activity as the JVM has to allocate and deallocate memory at short notice. Figure 10 shows that heap memory usage was well below 100%, indicating that there was no memory bottleneck in the application.
|
For general Java app troubleshooting tips, see: Top Java Problems & How to Fix them. |
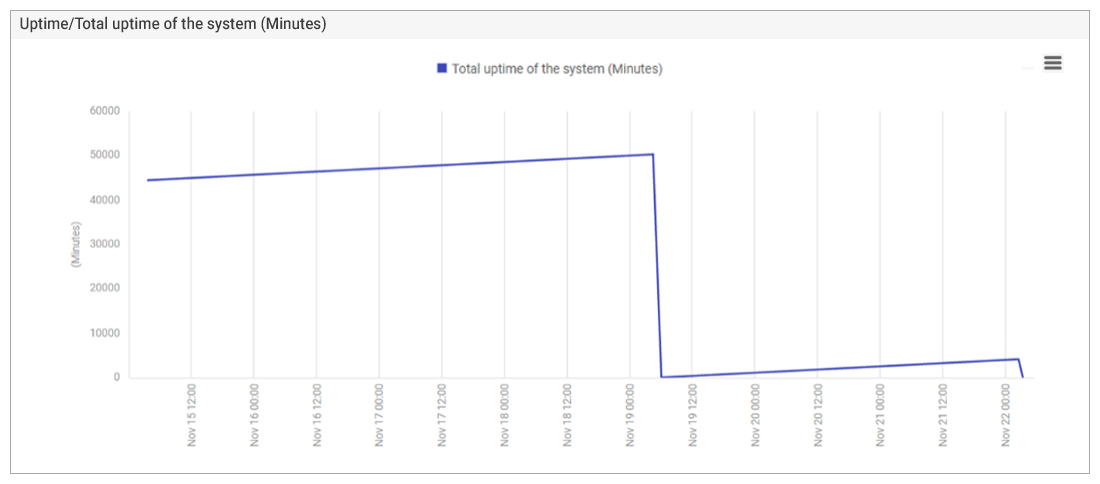
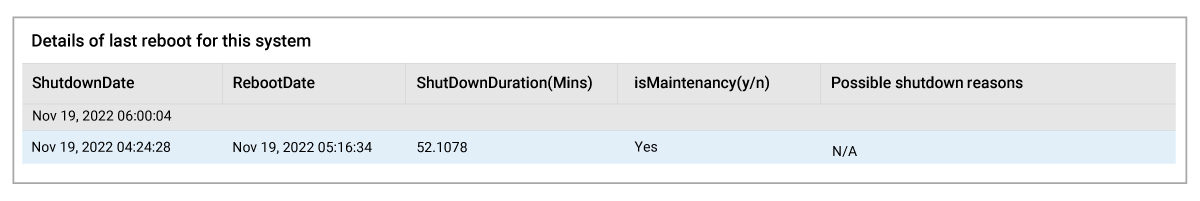
Step 5 – Deliberate Reboot or Outage?
The application team were certain they hadn’t changed their applications and suspected that the infrastructure team had been working on the server and applied changes that affected the applications. A quick check of the system uptime metrics confirmed that a reboot happened around 5am UTC. From the details of the reboot, one can see that the system had been in maintenance when it rebooted and the system had been down for 52 minutes– i.e., the reboot was probably intentional.
|
The nuances of Server Uptime vs Server Availability are covered in the article: What is Server Uptime Monitoring?. |
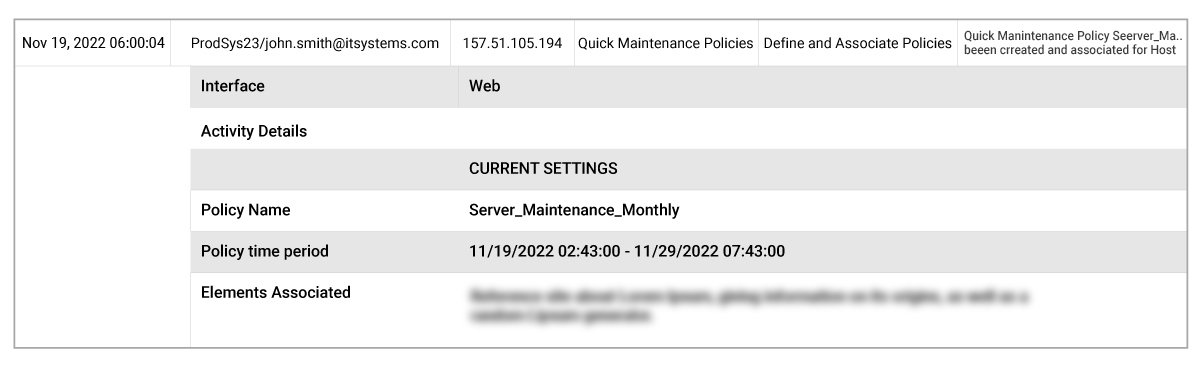
Step 6 – Identify Who was Responsible for the Maintenance?
At this point the application team also checked the maintenance policy history within eG Enterprise’s Admin audit features. Maintenance policies are a mechanism by which IT admins can communicate to other teams when they are working on systems. By doing so, they can also ensure that any alerts for components under maintenance are suppressed to ensure frontline support or other teams do not receive alerts reporting that systems are down, when the situation is controlled and by design. Analyzing eG Enterprise’s audit log, the application team could identify the engineer and team responsible for instigating and managing the maintenance.
|
There’s a quick 2 minute YouTube covering eG Enterprise Maintenance Policies available: How To Set Maintenance Policies in eG Enterprise – YouTube covering scheduling and ad hoc maintenance. |
The infrastructure team confirmed that they had indeed rebooted the systems after applying standard updates and nothing they did could have impacted application performance so drastically.
Step 7 – What had the Infrastructure Team Done?
At this point the application team started examining the Configuration Change history available in eG Enterprise. See: Change Tracking and Configuration Monitoring | eG Innovations for feature details.
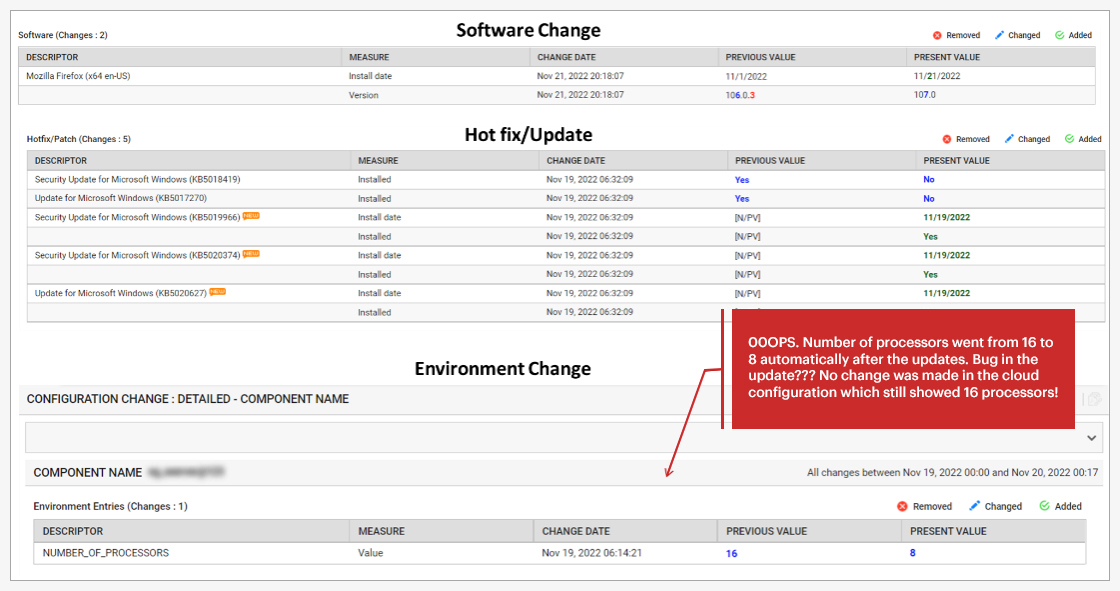
The infrastructure team had applied several Microsoft Security patches and upgraded a browser. None of these would by design normally affect the application performance.
However – the environmental configuration change records showed that the number of processors on the systems had changed from 16 to 8. This was surprising to everyone concerned.
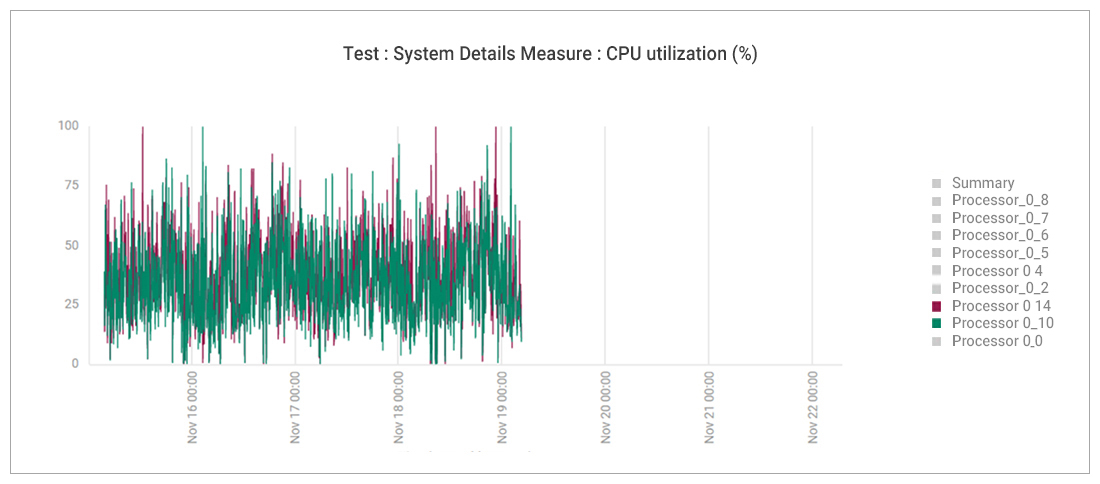
Looking at the performance charts by processor (Figure 14), it became clear that processors 9-16 had stopped being used post-reboot. The number of processors available to the applications had been halved. So, whilst the percentage (%) of CPU used by the applications had doubled their absolute usage remained unchanged.
With conclusive proof that the issue was indeed caused at the system level and not at the application level, the application team handed over to the infrastructure team.
Step 8 – The Infrastructure Team’s Analysis
The infrastructure team analyzed the changes they had made on the systems. After all, OS updates are applied every month and have not caused such issues. It turned out that a couple of weeks earlier, they had executed a script provided by the security team to harden their systems. This script included instructions to address a “Windows Speculative Execution Configuration Check” vulnerability. Microsoft’s recommendations are here: https://support.microsoft.com/en-us/topic/kb4073119-windows-client-guidance-for-it-pros-to-protect-against-silicon-based-microarchitectural-and-speculative-execution-side-channel-vulnerabilities-35820a8a-ae13-1299-88cc-357f104f5b11.
The registry keys below had been updated to disable hyperthreading:
- SYSTEM\CurrentControlSet\Control\Session Manager\Memory Management\FeatureSettingsOverrideMask
- SYSTEM\CurrentControlSet\Control\Session Manager\Memory Management\FeatureSettingsOverride
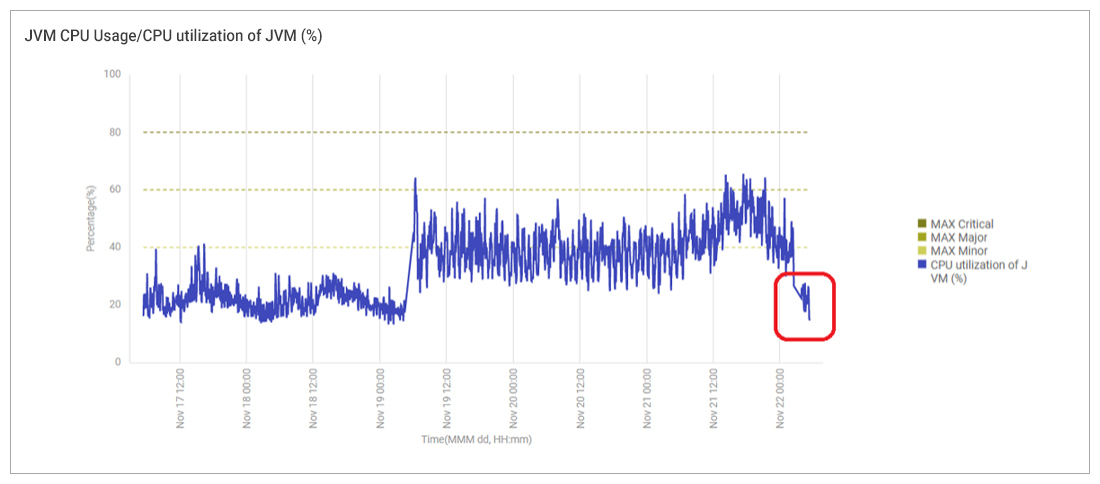
The registry key changes only took effect after the scheduled reboots and this is what caused the application level issues outlined earlier. Reverting the registry key change (and reapplying another recommendation from Microsoft to address the security vulnerability without disabling hyperthreading) brought the system performance back to normal as can be seen by the CPU usage drop in the red box in Figure 15.
|
To read more on configuration change tracking, see: Change Tracking and Configuration Monitoring Features. |

Lessons Learned
IT teams are increasingly automating deployments and adopting IaC (Infrastructure-as-Code) strategies, auto-scaling and scale-back are becoming common. Particularly when adopting ephemeral Serverless, microservice and container technologies it is critical to ensure monitoring platforms can track configuration changes and maintain auditable logs of system activity. Metrics about applications and infrastructure are meaningless without the knowledge of what those systems were and how they were configured.
Configuration and change tracking has an increasingly important role to play in modern, dynamic IT environments. Knowing what changed and when can enable correlation of performance impacts with configuration changes and help troubleshoot application slowness issues quickly.
eG Enterprise is an Observability solution for Modern IT. Monitor digital workspaces,
web applications, SaaS services, cloud and containers from a single pane of glass.
Further Reading
- Top Java Problems & How to Fix them | eG Innovations
- An overview of Java Performance Monitoring Tools, which enable you to prioritize problems automatically and provide actionable notifications
- How to Troubleshoot Java CPU Usage Issues: Troubleshoot Java CPU Usage | JVM High CPU Threads
- Change Tracking and Configuration Monitoring | eG Innovations
- Auditing Capabilities in IT Monitoring Tools | eG Innovations
- If you enjoyed this Postmortem blog post – you may enjoy these similar ones, Troubleshooting Web Application Performance & SSL Issues, End-to-End Monitoring of Application Performance (Java on WildFly and Microsoft SQL Case Study) and Application Performance Troubleshooting on AWS Cloud: A Case Study (eginnovations.com).
- How to Monitor IT Infrastructure when adopting IaC for VDI and Digital Workspaces | eG Innovations
 Barry is a pre-sales consultant at eG Innovations. Barry has 20+ years of IT experience and deep knowledge in Citrix technologies and is a specialist on Microsoft Windows, Desktop and Server virtualization and application delivery with Citrix ADC. Barry is an active community contributor and former Citrix Technology Professional. He is one of the co founders and a member of the board of the Dutch Citrix User.