Network Interfaces Test
This test monitors critical metrics relating to the Network interfaces of a target server/network device using MIB-II support provided by the server/device.
Target of the test : A Cisco device
Agent deploying the test : An external agent
Outputs of the test : One set of records for each interface of a router.
| Parameter | Description |
|
Test period |
How often should the test be executed |
|
Host |
The host for which the test is to be configured. |
|
SNMPPort |
The port at which the monitored target exposes its SNMP MIB; the default is 161. |
|
SNMPversion |
By default, the eG agent supports SNMP version 1. Accordingly, the default selection in the snmpversion list is v1. However, if a different SNMP framework is in use in your environment, say SNMP v2 or v3, then select the corresponding option from this list. |
|
SNMPCommunity |
The SNMP community name that the test uses to communicate with the firewall. This parameter is specific to SNMP v1 and v2 only. Therefore, if the SNMPVersion chosen is v3, then this parameter will not appear. |
|
Username |
This parameter appears only when v3 is selected as the snmpversion. SNMP version 3 (SNMPv3) is an extensible SNMP Framework which supplements the SNMPv2 Framework, by additionally supporting message security, access control, and remote SNMP configuration capabilities. To extract performance statistics from the MIB using the highly secure SNMP v3 protocol, the eG agent has to be configured with the required access privileges – in other words, the eG agent should connect to the MIB using the credentials of a user with access permissions to be MIB. Therefore, specify the name of such a user against the Username parameter. |
|
Context |
This parameter appears only when v3 is selected as the SNMPVersion. An SNMP context is a collection of management information accessible by an SNMP entity. An item of management information may exist in more than one context and an SNMP entity potentially has access to many contexts. A context is identified by the SNMPEngineID value of the entity hosting the management information (also called a contextEngineID) and a context name that identifies the specific context (also called a contextName). If the username provided is associated with a context name, then the eG agent will be able to poll the MIB and collect metrics only if it is configured with the context name as well. In such cases therefore, specify the context name of the username in the context text box. By default, this parameter is set to none. |
|
Authpass |
Specify the password that corresponds to the above-mentioned Username. This parameter once again appears only if the SNMPversion selected is v3. |
|
Confirm password |
Confirm the Authpass by retyping it here. |
|
Authtype |
This parameter too appears only if v3 is selected as the SNMPversion. From the AuthType list box, choose the authentication algorithm using which SNMP v3 converts the specified username and password into a 32-bit format to ensure security of SNMP transactions. You can choose between the following options:
|
|
Encryptflag |
This flag appears only when v3 is selected as the SNMPversion. By default, the eG agent does not encrypt SNMP requests. Accordingly, the this flag is set to no by default. To ensure that SNMP requests sent by the eG agent are encrypted, select the yes option. |
|
Encrypttype |
If the EncryptFlag is set to Yes, then you will have to mention the encryption type by selecting an option from the EncryptType list. SNMP v3 supports the following encryption types:
|
|
Encryptpassword |
Specify the encryption password here. |
|
Confirm Password |
Confirm the encryption password by retyping it here. |
|
Timeout |
Specify the duration (in seconds) within which the SNMP query executed by this test should time out in this text box. The default is 10 seconds. |
|
Data Over TCP |
By default, in an IT environment, all data transmission occurs over UDP. Some environments however, may be specifically configured to offload a fraction of the data traffic – for instance, certain types of data traffic or traffic pertaining to specific components – to other protocols like TCP, so as to prevent UDP overloads. In such environments, you can instruct the eG agent to conduct the SNMP data traffic related to the monitored target over TCP (and not UDP). For this, set this flag to Yes. By default, this flag is set to No. |
|
EngineID |
This parameter appears only when v3 is selected as the SNMPVersion. Sometimes, the test may not report metrics when AES192 or AES256 is chosen as the Encryption type. To ensure that the test report metrics consistently, administrators need to set this flag to Yes. By default, this parameter is set to No. |
|
OnlyUp |
If this flag is set to Yes, then only the network interfaces that are operational - i.e. whose MIB-II operStatus variable has a value "up" - are monitored. If this flag is set to No, all network interfaces that have an adminStatus of "up" will be monitored. By default, this flag is set to No, indicating that by default the test will monitor network interfaces that are up/down. |
|
Fullduplex |
If this value is Yes, then it indicates that all interfaces are full duplex. In this case, the eG Enterprise system will compute bandwidth usage % to be, max(input bandwidth, output bandwidth)*100/total speed. On the other hand, if this flag is set to No, then the computation of bandwidth usage % will be (input bandwidth + output bandwidth)*100/total speed. |
|
Exclude |
The Exclude text box takes a comma separated list of network interfaces that are to be excluded when performing the test. For example, if this parameter has a value of "Null0", then the Null0 interface of the network device will not be monitored by the eG agent. This specification can also include wild card characters. For instance, to disregard all interfaces which contain the string ether and null when monitoring, your Exclude specification should be: *ether*,*null*. |
|
Discoverbystate |
This flag controls how the test discovers network interfaces. If this flag is No, the operational state of an interface is not considered when discovering all the network interfaces of a router/switch/network device. If this flag is Yes(which is the default setting), only interfaces that have been in the up operational state will be considered for monitoring. In this mode, if an interface is down all of the time, it will not be considered for monitoring. However, once the interface starts to function, it will be tracked by the test and alerts generated if the interface state ever changes to down. |
|
Usealias and Show Alias and Interface Name |
Cisco and many network devices allow administrators to set the names for switch/router ports. These names can be set to logical, easily understandable values. Port names can be set in Cisco devices using the command "set port name". For example set port name 3/24 Federal_credit_union_link. This command indicates that the port 3/24 is used to support the Federal Credit Union. If the Usealias parameter is set to Yes, then a Show Alias AND Interface Name parameter will additionally appear, which is set to No by default. In this case, the agent will first try to look at the port name (from the if Alias SNMP OID) and use the port name if specified as the descriptor for the test results. If a port name is unavailable or if no port name/alias is specified in the network device setting, the interface description for each port provided in the SNMP MIB-II output is used instead as the descriptor for the test results. On the other hand, if the Usealias parameter is set to Yes and the Show Alias and Interface Name parameter is set to Yes, then each descriptor of this test will be represented in the format port name:interface description.For e.g., 1:local_lan_segment:GigabitEthernet 0/0. If the Usalias parameter is set to No, then the Show Alias and Interface Name parameter option will not appear. In this case therefore, the device name will be displayed as the descriptor of the test. |
|
UseExtension |
DEFAULT VALUE IS YES Interfaces Group MIB (RFC 2233) - NEW for metrics collection By default, this test polls the standard IF MIB (RFC 1213) - OLD to collect the required metrics. Set the UseExtension flag to Yes, if you want the test to poll the Interfaces Group MIB (RFC 2233) - NEW for metrics collection. By default this parameter is set to No. |
|
Use IFX Name |
By default, this flag is set to No, indicating that the eG agent polls the standard IF MIB to collect the performance metrics. If you want the eG agent to poll the IF-EXTENSION-MIB to collect the required metrics, set this flag to Yes. |
|
Speed Multiply Factor |
By default, none is displayed against this parameter. This indicates that the actual speed of each network interface of the target network device obtained as bits per second from the SNMP MIB II is automatically converted to Mbps and displayed against the Speed measure in the eG monitor interface. In some environments, network administrators may have explicitly set the speed of the target network device to Kbps or Mbps against the default speed of bits per second. In such cases, specify a suitable value against this parameter. If the speed of the network interface is set to kbps, then specify 1000 against this parameter. Alternately, if the speed of the network interface is set to Mbps, then set 1000000 against this parameter. |
|
Show Concise Metrics |
By default, this parameter is set to No indicating that the test will report all the metrics related to each network interface in the target environment. If this flag is set to Yes, then packet related metrics (for e.g., Non-unicast packets received, Transmit errors, Outbound protocols etc) will not be collected. It is recommended to set this flag to Yes in environments where database space is a constraint to collect all the metrics for a large number of network interfaces. |
|
Show Details |
By default, this flag is set to Yes indicating that the detailed diagnosis of the Bandwidth used measure will provide the maximum amount of data flow through the network interface at a given point of time. It is also mandatory to enable the Net Flows Test, to obtain the detailed diagnosis. If you do not wish to obtain the detailed diagnosis for the Bandwidth used measure, then set this flag to No. |
| Measurement | Description | Measurement Unit | Interpretation | ||||||||||||
|---|---|---|---|---|---|---|---|---|---|---|---|---|---|---|---|
|
Is the network interface operationally available? |
Indicates the availability of a network interface. |
|
If the operational state (i.e., the running state) of an interface is "up", then, this measure will report the value Yes. If the operational status of an interface is “down”, then this measure will report the value No. On the other hand, if the admin state (i.e., the configured state) of an interface is “down”, then the value of this measure will be: Administratively Down. The numeric values that correspond to each of the above-mentioned states are as follows:
Note: By default, this measure reports one of the States listed in the table above to indicate the status of an interface. The graph of this measure however, represents the same using the numeric equivalents – 0 to 200. |
||||||||||||
|
Data transmit rate |
Indicates the rate of data being transmitted from the router over a network link. |
Mbps |
This measurement depicts the workload on a network link. |
||||||||||||
|
Data received rate |
The rate of data being received by the router over a network link. |
Mbps |
This measure also characterizes the workload on a network link. |
||||||||||||
|
Total data throughput |
Indicates the overall data transmission to and from the router over a network link. |
Mbps |
This measure is the sum of Data transmit rate and Data received rate measures. |
||||||||||||
|
Speed |
Indicates the speed of the network interface. |
Mbps |
This is a static setting – in other words, it is a value that is explicitly set for a network interface through tools such as Cisco admin interface or through commands. This value will hence NOT change with time. eG uses this value to compute the percentage bandwidth usage of a network interface. This value cannot be used to determine how well the network interface is working. If you think that the above value is incorrect for a network interface, you can use the “bandwidth” interface sub-command of Cisco IOS (provided the network device being monitored is a Cisco device) to manually set the correct speed values for each network interface. |
||||||||||||
|
Bandwidth used |
Indicates the percentage utilization of the bandwidth available over a network link. |
Percent |
A value close to 100% indicates a network bottleneck. Detailed Diagnosis of this measure is reported only for the NetFlow Device component. The detailed Diagnosis lists the top flows of an interface by reporting the Source, Destination, Total flow data, Total flow packets, Percentage of interface flows and Direction. |
||||||||||||
|
Note: The speed of a network interface is based on the value of its SNMP MIB-II variable, which is set using router-specific commands (e.g., the "bandwidth" command of a Cisco router). When a network interface has a fixed maximum speed limit (e.g., Ethernet), the percentage bandwidth will be <= 100%. In some instances, service providers offer a minimum committed information rate (CIR). In such cases, the speed of the network interface is not fixed and may be set to the minimum CIR. Since user traffic may be in excess of the CIR at times, the percentage bandwidth measure could exceed 100%. In such cases, the percentage bandwidth measure is to be ignored. |
|||||||||||||||
|
Receive errors |
Indicates the rate of inbound packets that contained errors preventing them from being delivered to a higher-layer protocol |
Packets/Sec |
Ideally, this value should be 0. |
||||||||||||
|
Transmit errors |
Indicates the rate at which outbound packets could not be delivered as they contained errors |
Packets/Sec |
Ideally, this value should be 0. |
||||||||||||
|
In discards |
Indicates the rate at which inbound packets were discarded, though such packets did not contain any errors that could prevent them from being delivered to a higher-layer protocol. |
Packets/Sec |
One possible reason for discarding such a packet could be to free up buffer space. |
||||||||||||
|
Out discards |
Indicates the rate at which outbound packets were discarded, though such packets did not contian any errors that could prevent them from being delivered to a higher-layer protocol. |
Packets/Sec |
One possible reason for discarding such a packet could be to free up buffer space. If you have a large number of out discards, it means that the network device's output buffers have filled up and the device had to drop these packets. This can be a sign that this segment is run at an inferior speed and/or duplex, or there is too much traffic that goes through this port. |
||||||||||||
|
Non-unicast packets received |
Indicates the rate at which packets which were addressed as multicast or broadcast were received by this layer. |
Packets/Sec |
|
||||||||||||
|
Non-unicast packets transmitted |
Indicates the rate at which packets which were addressed as multicast or broadcast were sent by this layer. |
Packets/Sec |
|
||||||||||||
|
Unicast packets received |
Indicates the rate at which packets which were not addressed as multicast or broadcast were received by this layer. |
Packets/Sec |
|
||||||||||||
|
Unicast packets transmitted |
Indicates the rate at which packets which were not addressed as multicast or broadcast were sent by this layer. |
Packets/Sec |
|
||||||||||||
|
Unknown protocols |
Indicates the rate at which unknown protocols were received. |
Packets/Sec |
For packet-oriented interfaces, this measure will report the number of packets received via the interface which were discarded because of an unknown or unsupported protocol. For character-oriented or fixed-length interfaces that support protocol multiplexing, this measure reports the number of transmission units received via the interface which were discarded because of an unknown or unsupported protocol. For any interface that does not support protocol multiplexing, this counter will always be 0. |
||||||||||||
|
Queue length |
Indicates the length of the output packet queue. |
Number |
A consistent increase in the queue length could be indicative of a network bottleneck. |
||||||||||||
|
Outbound packet discards |
Indicates the number of error-free outbound packets that were discarded by this network interface during the last measurement period. |
Number |
Ideally, the value of these measures should be zero. These measures may report a non-zero value when an interface runs short of resources – e.g., NIC buffers.
|
||||||||||||
|
Inbound packet discards |
Indicates the number of error-free inbound packets that were discarded by this network interface during the last measurement period. |
Number |
|||||||||||||
The detailed diagnosis of the Bandwidth used measure (reported only for NetFlow Device components) lists the top flows of an interface by reporting the Source, Destination, Total flow data, Total flow packets, Percentage of interface flows and Direction.
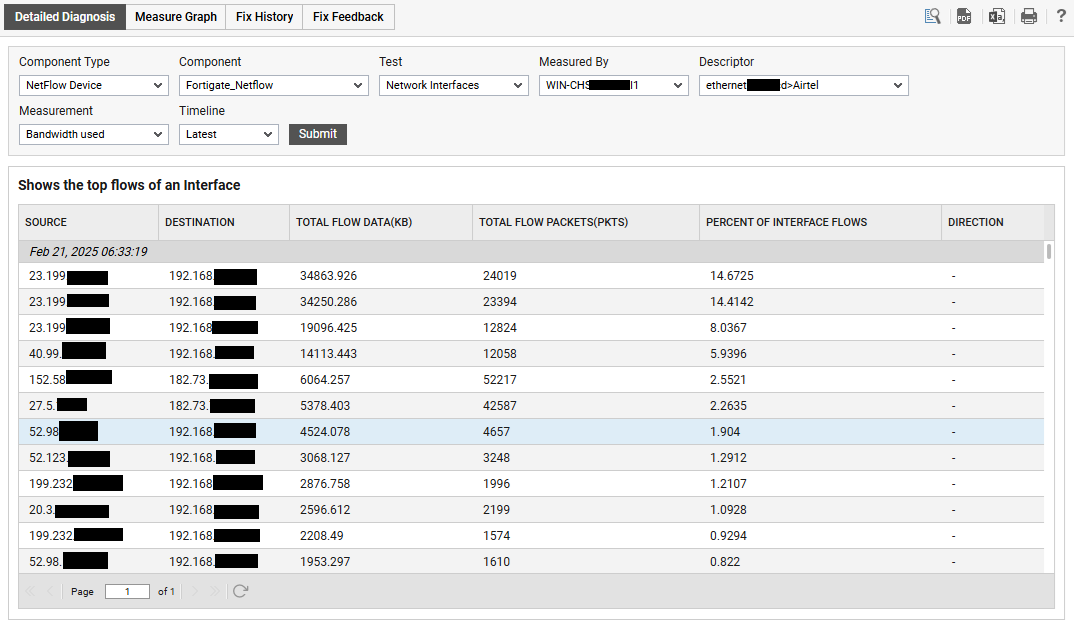
Figure 1 : The detailed diagnosis of the Bandwidth used measure