SQL Applications Test
Sometimes the database performs poorly due, not to blocking, but to particularly heavy loads. Often the DBA will determine that the database simply cannot support the work that it is being asked to do and maintain adequate performance. This does not necessarily mean it is time to create more indexes or throw more hardware at the problem. One cannot always assume that periods of high utilization represent legitimate work. There could be problems in the applications that are running, or even problems caused by the user. Maybe the application has a data paging functionality, but the user has opted to receive the entire 100,000 row DataSet every time, even though she/he has applied a sort which gives her the one row she needs first with each query. Regardless, it is important to identify performance issues and eliminate them. The SQL Applications test identifies which program has more connections open to (i.e., processes running in) the SQL database. Simply looking at the CPU cycles taken up by a process will not indicate which of these processes has been most active recently. For example, the SQL Server internal processes may have been running for days and will probably always show up as the processes that have taken the most CPU time since the database booted up. Hence, it is more helpful to find processes that have used lots of CPU for the majority of the time that they have been connected. This value represents how “expensive” a process is with respect to the SQL database server.
For each program that connects to the database server, the SQL Applications test reports the total CPU cycles for each second that the program is connected to the database. This value, represented by the CPU cycles rate measure, is an aggregate of all the CPU cycles consumed by every instance of the program while it is connected to the database server. The Avg CPU cycles rate measure represents the CPU cycles rate averaged across the number of processes in the database for the program under consideration. The Avg CPU cycles rate quantifies how bad a program is compared to the others, by dividing the CPU cycles rate by the number of connected instances. A high value for this value would indicate that every instance of the program was CPU-intensive. A lower value would indicate that the program may have some instances that cause performance problems, but also has instances that are mostly idle.
This test has been disabled by default. To enable this test, go to the enable / disable tests page using the menu sequence : Agents -> Tests -> Enable/Disable, pick Microsoft SQL as the Component type, Performance as the Test type, choose this test from the disabled tests list, and click on the << button to move the test to the ENABLED TESTS list. Finally, click the Update button.
Note:
This test is applicable only to Microsoft SQL Server 2005 (and above).
Target of the test : A Microsoft SQL server
Agent deploying the test : An internal agent
Outputs of the test : One set of results for every program on the MS SQL server monitored
|
| Measurement | Description | Measurement Unit | Interpretation |
|---|---|---|---|
|
Number of processes: |
Indicates the number of database processes associated with a specific program. |
Number |
A comparison of this value across programs will indicate which program is initiating most connections to the database. Comparison of this value over time can provide indications of potential changes in database activity characteristics of a program. |
|
CPU cycles rate: |
Indicates the number of CPU cycles consumed by all processes of a program, per minute of login. |
Cycles/sec |
The higher the value, the more CPU resources that the program is taking in the database. |
|
Avg CPU cycles rate: |
Indicates the number of CPU cycles consumed by a process of a program, per minute of login. |
Cycles/Conn |
This value is the ratio of the CPU cycles rate to the number of processes for a program. |
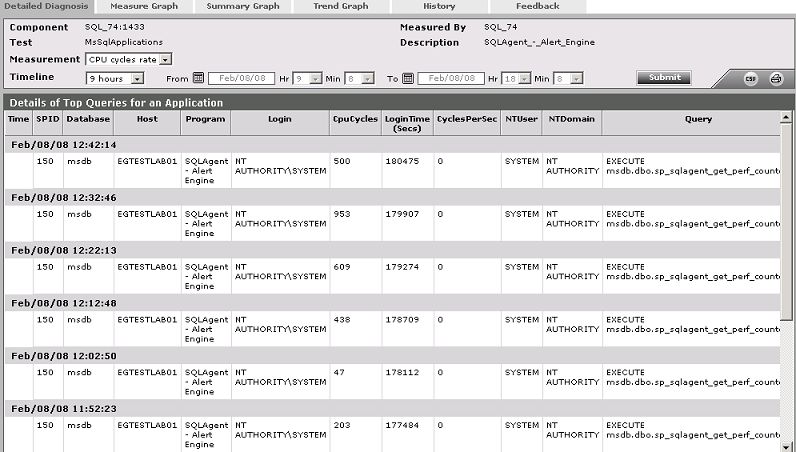
The detailed diagnosis of the CPU cycles rate measure of this test provides details of the most expensive queries to the database - i.e., what host is a program running from, who is running it, and what application is running it, which database the program is accessing, etc (see Figure 1).

Figure 1 : The detailed diagnosis of the CPU cycles rate measure