BW Queries Test
BEx queries filter the data to create reporting objects or views called InfoProviders. Some InfoProviders contain actual data. Others provide views of data stored in elsewhere. Using queries, the data can be quickly targeted and evaluated. The more precisely the query is defined, the query can be navigated and refreshed at a faster pace.
Query runtime statistics are used to analyse the average query execution time in different layers such as front end, OLAP or data manager. This can also be used to determine the execution time of certain user actions in the front end and in the analytic engine. The system records all these processing steps in the statistical tables, which are known as statistics events. It calculates the net time taken for processing of a query by calculating the runtime of an event using the difference between the start and end time. If the queries do not execute faster or if the queries fail to execute, then the data could not be retrieved and generated for the target SAP Business Warehouse instance. To proactively figure out the queries that are taking too long to execute and to figure out where exactly the queries spend most of the time upon execution, administrators can use the BW Queries test.
This test auto-discovers the queries created on the target SAP Business Warehouse instance and for each query, this test reports the number of sessions that initiated the query. In addition, this test reports the number of times each query was executed and the time taken by each query for execution. Using this test, administrators can figure out the query that is the slowest to execute. Also, this test throws light on where exactly the query took too long to execute - is it in the front end? or OLAP? or data manager package?
Target of the test : A SAP Business Warehouse Instance
Agent deploying the test : An internal agent
Outputs of the test : One set of results for each query created on the target SAP Business Warehouse Instance being monitored.
| Parameter | Description |
|
Test Period |
How often should the test be executed |
|
Host |
Host name of the server for which the test is to be configured. |
|
Port |
Enter the port at which the specified host listens. |
|
ClientName |
Specify the ID of the client system as what the eG agent will be connecting to the SAP ABAP instance. To know how to determine the client ID to use, follow the instructions provided in Determining the Client ID/Name for the eG Agent to Connect to the SAP ABAP Instance. |
|
SAPUser |
Typically, to connect to a SAP ABAP instance and run tests, the eG agent requires the permissions of a SAP user who has been assigned |
|
Password |
The password of the specified SAPUser. |
|
Confirm Password |
Confirm the password by retyping it here. |
|
SysNo |
An indicator of the TCP/IP port at which the SAP server listens. For example, for a server that listens at port 3200, the SysNo will be ‘00’. Similarly, if the SAP server port is 3201, the SysNo will have to be specified as ‘01’. Therefore, in the SysNo text box specify the system number of the SAP server with which the specified client communicates. To know the system number for the ABAP server being monitored, follow the procedure detailed in Identifying the SAP Router String and System Number. |
|
Router |
If the SAP client with the specified ClientName exists in a network external to the SAP server, then a router will be used to enable the server-client communication. In such a case, specify the router string of the router in the Router text box. If both the client and the server exist in the same network, then specify ‘none’ against the Router text box. To know what is the SAP Router string for the ABAP server being monitored, follow the procedure detailed in Identifying the SAP Router String and System Number. |
|
InstanceName |
This is set to default by default. This implies that the eG agent automatically discovers the instance name at run time. |
|
Timeout |
Indicate the duration (in seconds) for which this test should wait for a response from the SAP Business Warehouse Instance. By default, this is set to 120 seconds. |
|
JCO Version |
The eG agent uses the SAP JCO library to connect to the SAP ABAP system and pull out metrics. To enable the eG agent to make this connection and query the metrics, you need to specify the version of the SAP JCO library that the agent needs to use. For instance, to instruct the eG agent to use JCO v2.1.19, it would suffice if you specify the ‘major version number’ alone against JCO Version – in the case of this example, this will be 2.x. Note that if you have downloaded the SAP JCO CONNECTOR files for SAP JCO version 3 from the SAP market place (as instructed by Downloading the SAP JCO Connector files Required for Monitoring ), then the JCO Version configuration should be 3.x. |
|
Event Window |
By default, the BW events related to BW objects such as queries, templates and workbooks will be stored in an event table within the target SAP Business Warehouse Instance. An event record may be logged in the event table upon execution of the query in the target Business Warehouse Instance either immediately or with a time delay. When the event record is logged with a time delay, eG Enterprise may sometimes miss the event completely from the scope of monitoring. This is because, the event record will display the time stamp at which the event was logged rather than the time stamp at which the event actually started. To ensure that all the events related to query execution are monitored, administrators can use the Event Window parameter. By default, this is set to 90 minutes indicating that the eG agent will look for the event records in the last 90 minutes and fetch the relevant metrics. This will ensure that the events related to the queries are monitored round the clock without a miss! |
|
DD Frequency |
Refers to the frequency with which detailed diagnosis measures are to be generated for this test. The default is 1:1. This indicates that, by default, detailed measures will be generated every time this test runs, and also every time the test detects a problem. You can modify this frequency, if you so desire. Also, if you intend to disable the detailed diagnosis capability for this test, you can do so by specifying none against DD frequency. |
|
Detailed Diagnosis |
To make diagnosis more efficient and accurate, the eG Enterprise embeds an optional detailed diagnostic capability. With this capability, the eG agents can be configured to run detailed, more elaborate tests as and when specific problems are detected. To enable the detailed diagnosis capability of this test for a particular server, choose the On option. To disable the capability, click on the Off option. The option to selectively enable/disable the detailed diagnosis capability will be available only if the following conditions are fulfilled:
|
| Measurement | Description | Measurement Unit | Interpretation |
|---|---|---|---|
|
Sessions |
Indicates the number of sessions in which this query was initiated during the last measurement period. |
Number |
A high value for this measure is a indication that the query is called for frequent execution. This may sometimes lead to slowness in query execution. |
|
Steps |
Indicates the number of steps that were executed for this query during the last measurement period. |
Number |
A high value for this is an indication that the query is slow to execute. |
|
Executions |
Indicates the number of times this query was executed during the last measurement period. |
Number |
This measure is a good indicator of load on the SAP Business Warehouse Instance. Compare the value of this measure across workbooks to figure out the workbook that is executed more frequently. |
|
Execution rate |
Indicates rate at which this query was executed during the last measurement period. |
Execution/min |
|
|
Selected records |
Indicates the number of records that were selected from the database by this query upon an execution. |
Records/execution |
|
|
Transported records |
Indicates the number of records that were transported from the database by this query upon an execution. |
Records/execution |
|
|
Response time |
Indicates time taken by this query to complete an execution. |
Seconds/execution |
Compare the value of this measure across workbooks to figure out the workbook that is the slowest in terms of execution. Use the detailed diagnosis of this measure to figure out the executions that were the slowest for each workbook. The detailed diagnosis of this measure lists the name of the user, Start time, Info provider, Selected records, Transported records, Response time, OLAP time, OLAP cache time, Data manager time, OLAP authorization time, OLAP input help time, OLAP services time, Query Generation time, Data read time, Data selection time, Front end data transfer time, Read texts time, Badi compute time, Other events time, Properties, Session ID, Step ID and HandleID. |
|
OLAP time |
Indicates the Online Analytical processing time taken per execution by this query. |
Seconds/execution |
|
|
OLAP cache time |
Indicates the average OLAP time taken by this query for cache operations upon an execution. |
|
Cache operations comprises of generation of cache entry, read from cache, write to cache, and deletion of cache entries. |
|
Data manager time |
Indicates the time taken by this query to collect data from the data manager package upon execution. |
Seconds/execution |
|
|
OLAP authorization time |
Indicates the OLAP time taken by this query for all authorization upon an execution. |
Seconds/execution |
The value of this measure is a sum of time taken to determine the authorized individuals and intervals, time taken to determine authorized hierarchy nodes, check the authorizations and buffer authorizations. |
|
OLAP input help time |
Indicates the OLAP time taken by this query to generate input help upon an execution. |
Seconds/execution |
This measure is the sum of the time taken for value help, value help DB and value help for hierarchy nodes. |
|
OLAP services time |
Indicates the OLAP time taken by this query to complete processing the data upon an execution. |
Seconds/execution |
|
|
Query generation time |
Indicates the average time taken by this query to check the query definition and generate the output upon an execution. |
Seconds/execution |
|
|
Data read time |
Indicates the time taken by this query to collect the requested data from the data manager package or from the OLAP cache upon an execution. |
Seconds/execution |
|
|
Data selection time |
Indicates the time taken by this query to query the data manager package in order to sort the read data according to structure element selection or a restricted key figure upon an execution. |
Seconds/execution |
|
|
Front end data transfer time |
Indicates the time taken by this query to transfer data to the front end upon execution. |
Seconds/execution |
|
|
Read text time |
Indicates the time taken by this query to read the text from the data upon an execution. |
Seconds/execution |
|
|
Business add-in time / user exit time |
Indicates the time taken by this query to execute business add in or user exit. |
Seconds/execution |
|
|
Other events time |
Indicates the time taken by this query to perform other events/activities upon an execution. |
Seconds/execution |
|
The detailed diagnosis of the Response time measure lists the name of the user, Start time, Info provider, Selected records, Transported records, Response time, OLAP time, OLAP cache time, Data manager time, OLAP authorization time, OLAP input help time, OLAP services time, Query Generation time, Data read time, Data selection time, Front end data transfer time, Read texts time, Badi compute time, Other events time, Properties, Session ID, Step ID and HandleID. This helps to figure out the top executions that were the slowest for each query.
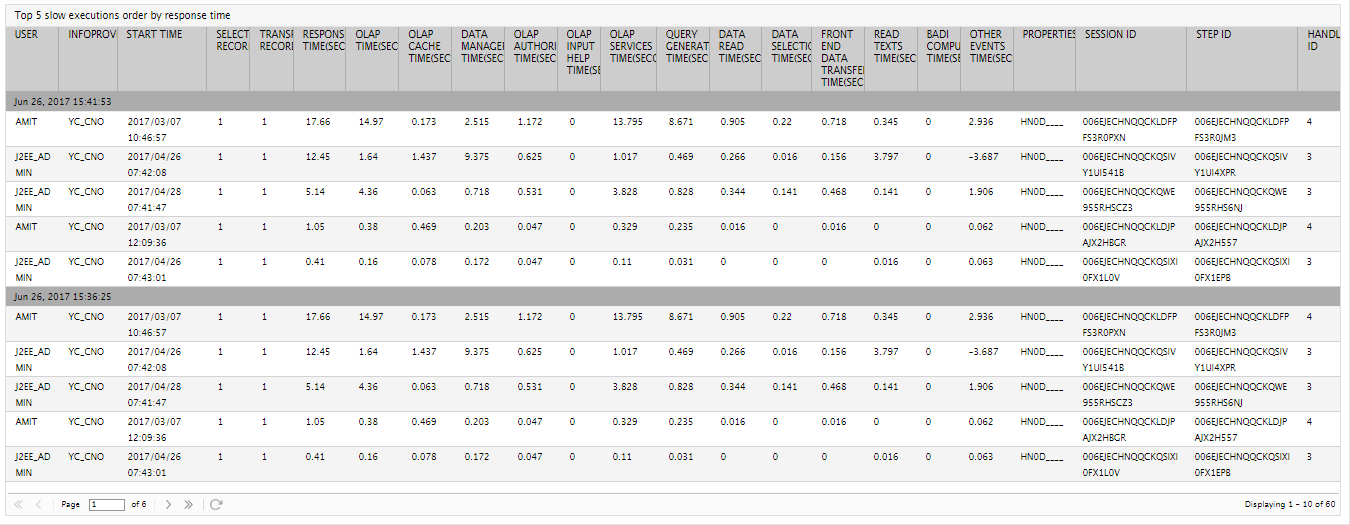
Figure 1 : The detailed diagnosis of the Response time measure