SAP WAS ICM Workload Test
The Internet Communication Manager ensures that communication between the SAP System (SAP Web Application Server) and the outside world via HTTP, HTTPS and SMTP protocols works properly. In its role as a server, the ICM can process requests from the Internet that arrive as URLs with the server/port combination that the ICM can listen to. The ICM then calls the relevant local handler for the URL in question.
The ICM process uses threads to parallel process the load. The following illustration shows a detailed overview of the ICM.
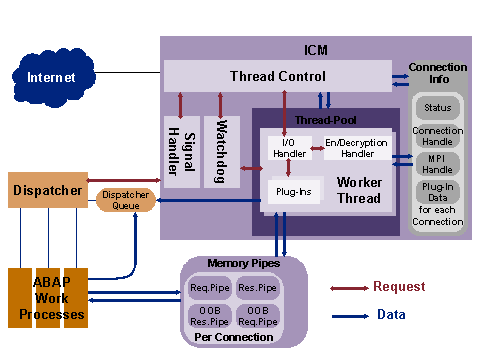
Figure 1 : Detailed overview of the ICM
Besides the pool of worker threads, which process incoming requests, the following ICM components are also implemented as threads:
- Thread Control: This thread accepts the incoming TCP/IP requests and creates (or wakes) a worker thread from the thread pool to process the request. From this point on, thread control initializes the connection info data.
- Worker Threads: These threads handle connection requests and responses. A worker thread contains an I/O handler for the network input and output, diverse plugins for the various supported protocols (HTTP, SMTP,…), which are required to be able to decide when the sent packet is finished (depends on the protocol).
- Watchdog: Usually, a worker thread waits for the response, regardless of whether the worker thread is a server or a client.If a timeout occurs, the watchdog takes on the task of waiting for the response. This makes the worker thread available for other requests. When the watchdog receives the response, it informs the thread control components, which then call a worker thread.
- Signal Handler: This thread processes signals sent from the operating system or from another process (for example, the dispatcher).
- Connection Info: This table contains information about the state of the connection, the memory pipes, and the plug-in data for every existing network connection.
- Memory Pipes: Memory pipes are memory-based communication objects that handle data transfer between the ICM and the work processes. For each connection there are four pipes: for each request and response one data pipe and an OOB (Out Of Band) pipe. The OOB pipe is used for control data.
- Internet Server Cache: The ICM contains another cache to enable repeated requests to be quickly responded to. This cache is not shown in the graphic
If any of these threads is unavailable or is slow, then HTTP/S requests received by the SAP WAS cannot be serviced quickly. Such processing delays can severely hamper the experience of Internet users with the SAP. This is why, it is imperative that SAP administrators proactively detect such slowdowns, accurately identify when the slowdown occurred, and pinpoint the precise thread responsible for it. This is where the SAP WAS ICM Workload test helps!
This test monitors the ICM and reports the count of maximum threads allocated and sheds light on the count threads that are currently running, created etc. By periodically monitoring the connections opened by the worker threads and the queue entries occupied with incoming requests, administrators can analyze the load on the ICM. This helps administrators rapidly troubleshoot slowdowns and avert serious outages.
Target of the test : A SAP NetWeaver Application Server
Agent deploying the test : An internal/remote agent
Outputs of the test : One set of results for the target SAP Web Application server being monitored.
| Parameter | Description |
|---|---|
|
Test period |
How often should the test be executed |
|
Host |
Specify the server for which the test is to be configured. |
|
Port |
The port number at which the specified server listens. |
|
WSDL Port |
This test uses the SAPControl web service to pull metrics on application and service status. To enable the test to communicate with the web service, you need to configure the test with the port number of the web service. Therefore, specify the port number of the SAPControl web service against WSDL Port. To determine the exact port number of the SAPControl web service, you can look up the etc/services file on the SAP WAS being monitored. If the port number is not declared in the etc/services file, you can specify the default port number of the web service against WSDL Port. If the web service is not SSL-enabled, then the default port number of the web service will be: 5<NR>13. Similarly, if the web service is SSL-enabled, then the default port number of the web service will be: 5<NR>14. <NR> in the port number refers to the system number of the SAP server being monitored. The system number is an indicator of the TCP/IP port at which the SAP server listens. For example, for a server that listens at port 3200, the system number will be ‘00’. Similarly, if the SAP server port is 3201, the system number will have to be specified as ‘01’. Accordingly, the default port number of an SSL-enabled SAPControl web service will be 50014 , if the system number is 00, or 50114, if the system number is 01. |
|
OS Username and OS Password |
To enable the test to access the SAPControl web service and determine component state, you need to configure the OS Username and OS Password parameters of the test with the credentials (i.e., name and password) of an OS user, who fulfills one of the following conditions:
|
|
Confirm Password |
Confirm the OS Password by retyping it here. |
|
SSL |
Set this flag to Yes, if the SAPControl web service is SSL-enabled. Set this flag to No, if the SAPControl web service is not SSL-enabled. |
|
Process Param Check (HRS) |
When configuring the SAP ICM Manager, administrators configure the Maximum Connections and Maximum Threads that can be allocated/utilized by the server. This configuration will not change until the administrators decide to increase the connections/threads handled by the server. By default, the eG agent pulls out the Maximum Connections and Maximum Threads measures during every test execution i.e., once in every 5 minutes. Since these values tend to remain constant until the SAP administrators configure a different value, pulling out these measures during every test execution will be repetitive and may cause an overhead to the eG backend database. To avoid such unnecessary overheads, you can use the Process Param Check parameter. By default, this parameter is set to 24 Hours indicating that the eG agent will pull out metrics for the Maximum Connections and Maximum Threads parameter once in 24 hours. |
|
DD Frequency |
Refers to the frequency with which detailed diagnosis measures are to be generated for this test. The default is 1:1. This indicates that, by default, detailed measures will be generated every time this test runs, and also every time the test detects a problem. You can modify this frequency, if you so desire. Also, if you intend to disable the detailed diagnosis capability for this test, you can do so by specifying none against DD Frequency. |
|
Detailed Diagnosis |
To make diagnosis more efficient and accurate, the eG Enterprise embeds an optional detailed diagnostic capability. With this capability, the eG agents can be configured to run detailed, more elaborate tests as and when specific problems are detected. To enable the detailed diagnosis capability of this test for a particular server, choose the On option. To disable the capability, click on the Off option. The option to selectively enable/disable the detailed diagnosis capability will be available only if the following conditions are fulfilled:
|
| Measurement | Description | Measurement Unit | Interpretation |
|---|---|---|---|
|
Running threads |
Indicates the number of running threads. |
Number |
|
|
Idle threads
|
Indicates the number of threads that were idle. |
Number |
|
|
Percentage running threads |
Indicates the percentage of threads that are running on the target SAP Web Application server. |
Percentage |
|
|
Created threads |
Indicates the number of instantiated worker threads that are currently processing requests. |
Number |
|
|
Percentage threads created |
Indicates the percentage of instantiated worker threads that are currently processing requests. |
Percentage |
|
|
Percentage created threads running |
Indicates the percentage of instantiated worker threads that are currently running. |
Percentage |
|
|
Maximum threads |
Indicates the maximum number of threads that are allocated to the server. |
Number |
|
|
Maximum connections |
Indicates the maximum number of connections that can be handled by the server. |
Number |
|
|
Maximum queue threads |
Indicates the maximum number of threads that are currently in queue. |
Number |
|
|
Used connections |
Indicates the number of connections that are opened by the worker threads. |
Number |
If the value of these measures are consistently high, then, try increasing the size of the worker connections. |
|
Percentage connections used |
Indicates the percentage of connection that are opened by the worker threads. |
Percentage |
|
|
Used queue entries |
Indicates the number of queue entries occupied with incoming requests. |
Number |
If the value of these measures are consistently high, then, try increasing the maximum number of queue entries. |
|
Percentage queue entries used |
Indicates the percentage of queue entries occupied with incoming requests. |
Percentage |