Sybase Process Waits Test
A wait event occurs when a server process suspends itself, sleeps, and waits for another event to wake it. The Sybase ASE includes unique wait event IDs for each of these wait events.
The test monitors each type of wait events on the Sybase database server and reports key performance statistics pertaining to every event type. For execution, this test requires the enable monitoring and process wait events configuration parameters to be enabled.
Target of the test : A Sybase ASE on which MDA tables have been installed
Agent deploying the test : An internal agent
Outputs of the test : One set of results for every wait event type being monitored.
| Parameter | Description |
|---|---|
|
Test Period |
How often should the test be executed. |
|
Host |
Refers to the IP address of the Sybase ASE server. |
|
Port |
The port number at which the Sybase server listens to. |
|
User |
To enable this test to connect to the Sybase server and collect the required metrics, it is enough if you configure the test with the name of a Sybase user who has the “mon_role”. However, for best results, it is recommended that you configure all Sybase tests with the credentials of a Sybase user who has the “mon_role”, “sa_role’, and “sybase_ts_role”. |
|
Password |
The password corresponding to the above user |
|
Confirm Password |
Confirm the password by retyping it here. |
|
Detailed Diagnosis |
To make diagnosis more efficient and accurate, the eG Enterprise embeds an optional detailed diagnostic capability. With this capability, the eG agents can be configured to run detailed, more elaborate tests as and when specific problems are detected. To enable the detailed diagnosis capability of this test for a particular server, choose the On option. To disable the capability, click on the Off option. The option to selectively enable/disable the detailed diagnosis capability will be available only if the following conditions are fulfilled:
|
| Measurement | Description | Measurement Unit | Interpretation |
|---|---|---|---|
|
Number of waits |
The number of events of this wait event type during the last measurement period. |
Number |
Use the detailed diagnosis of this measure to view the complete details of the wait events and to figure out who and which process initiated the event. |
|
Avg wait time |
The average wait time of events of this type. |
MillSeconds |
If this measure value is high for a particular event type when the value of the Number of waits measure is low, it could indicate that one/more events of that type have been waiting for a long time. The DBA might have to ensure that such wait events are minimal. |
The detailed diagnosis of the Number of waits measure will reveal the description of the wait event, the user and the process that initiated the wait event, the total number of waits, and the total time waited.
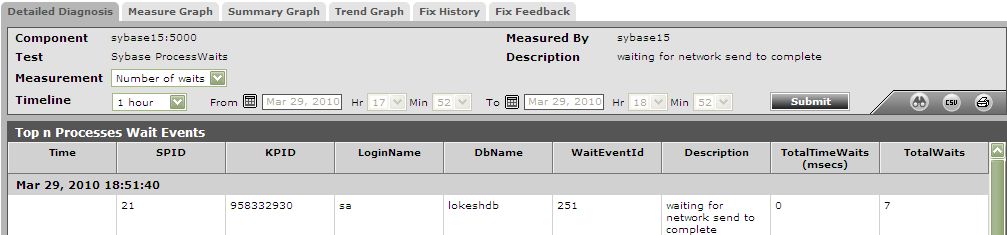
Figure 1 : The detailed diagnosis of the Number of waits measure