Monitoring Zoom
To monitor the managed Zoom, login to the eG management console as a user with monitoring privileges.
Browse the Components At-A-Glance section of the Monitor Home page that appears, and locate the Zoom component type. Click on the bar that corresponds to this component type. This will lead you to the Layers tab page, where you can view the monitoring model for Microsoft Teams (see Figure 1).
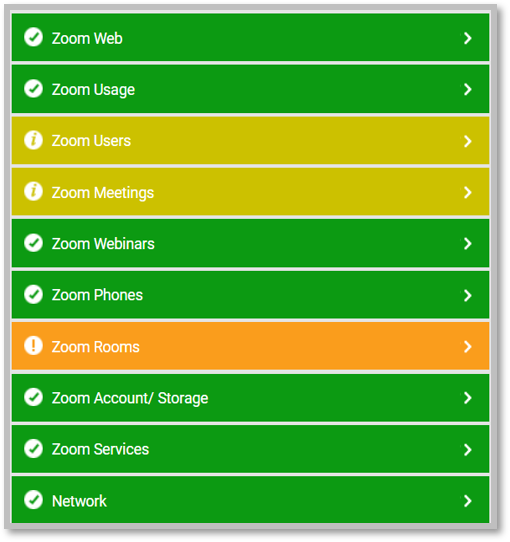
Figure 1 : Layer model for the Zoom component
Each layer of Figure 1 is mapped to tests that report on a wide variety of KPIs such as availability, service health, resource usage, and operational health of Zoom. Using these metrics, administrators can find quick and accurate answers to the following performance queries:
- Is HTTP/S connection to the Zoom is available? Was any latency noticed in the connection?
- Is network connection to Zoom available? If so, how quickly is it responding to network requests?
- Are the Zoom webhook events getting received?
- Are participants able to join the Zoom meetings?
- How was the quality of meetings, calls, webinars? What was the user satisfaction level?
- How many users are associated with current Zoom account? How many of these users are inactive?
- How many users are of each type including Basic, Licensed and OnPrem?
- Which are the user license types for which the Zoom is pending provisioning/pending activation?
- What are different version of Zoom client that people are using, what is the number of users using each of the version.
- How many teams/channels are created on Zoom?
- How many calls/meetings/private chat mesages were initiated/attended by each user on Zoom?
- How many daily meetings are organized? How many participant join on daily?
- How many total messages were sent? How many audio and video files are sent?
- How may call were placed? How many of them connected? What was the duration of each call?
- How many users signed in during the day? How many of them signed out?
- How many users are created and deleted? How many are activated?
- How many times role of a user was modified in a team?
- How many users were unique to initiate calls/meetings/private chat messages/team chat messages?
- How many recordings were created? What is the total size of recordings?
- How much plan storage and free storage is occupied by recordings? How much storage is available for recording?
- How was the quality of audio, video and screen sharing in the meeting?
- How many Zoom room are created, how many of them have critical issues?
- What is the usage of Zoom rooms? How many of them are inactive?
- What is the status of Zoom services? What is the scheduled downtime?
- What is the billing plan subscription? How many times the plan changes in a month?
For more information on the Network layer, refer to the Monitoring Unix and Windows Servers document. This