

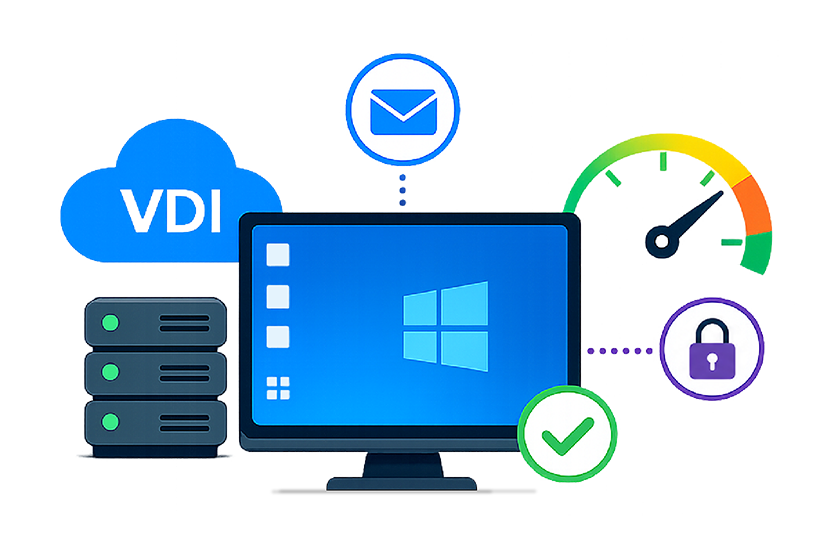
Remote and hybrid work turned virtual desktops from a niche IT choice into a core way employees get their jobs done. When a desktop lives in the data center or the cloud, every logon, click, and screen refresh depends on infrastructure the user never sees. That shift is why VDI monitoring matters: it protects the end-user experience when the desktop is no longer local. The challenge is that a single slow session can have dozens of causes—across compute, storage, network, and the broker layer. Effective VDI monitoring turns “the desktop is slow” into a specific, fixable root cause.
What Is VDI Monitoring?
Understanding Virtual Desktop Infrastructure Monitoring
VDI monitoring is the continuous measurement of performance, availability, and user experience across a virtual desktop deployment. It tracks how quickly users log on, how responsive sessions feel, and how the infrastructure holds up under load—flagging whether the user’s experience is suffering, and where.
Components of a VDI Environment
A VDI deployment is a chain of dependencies, and a weak link shows up as a slow desktop:

Virtual desktops
The Windows or Linux sessions users work in, plus their agents and profiles.

Hypervisors
The virtualization layer (vSphere, XenServer, Nutanix AHV, Hyper-V) hosting the desktops.
Storage
Where images, profiles, and data live.
Network
The path from device to data center or cloud.

Broker and access tiers
The brokers, gateways, and authentication services that route every session.
Why Traditional Monitoring Falls Short for VDI
Traditional infrastructure monitoring watches servers and resources in isolation, so a CPU graph can look healthy while users still complain—it has no view of the session experience or the dependencies between tiers.
VDI is multi-tier: a storage problem can surface as a slow logon, and a network issue can look like an application fault. VDI-aware monitoring correlates the layers, so symptoms and cause appear in the same picture.
Common VDI Performance Problems

Slow Desktop Logons
Logon time is the first impression users get—and a top complaint in any VDI environment. A logon involves authentication, profile loading, group policy, drive mapping, and application launch—any of which can stall. Without monitoring that breaks logon into stages, the slow step is hard to isolate.
High Latency and Session Disconnects
Virtual desktops depend on a display protocol such as RDP, ICA/HDX/EDT, Blast, or PCoIP. When network latency, packet loss, or bandwidth limits degrade that protocol, sessions feel sluggish, screens lag behind input, and connections drop.
Resource Contention in Virtual Environments
Consolidating desktops onto shared hosts makes VDI cost-effective, but it creates competition for CPU, memory, storage I/O, and GPU. A single runaway session or oversubscribed host can drag down everyone sharing that hardware—the classic “noisy neighbor” problem.
Poor User Experience During Peak Usage
When most of a workforce logs on within the same morning window, the resulting “logon storm” hammers brokers, authentication, and storage at once. Capacity that looks fine at midday can buckle at 9 a.m., producing slow starts when productivity matters most.
Key Features of Modern VDI Monitoring Tools
The best VDI monitoring tools shorten troubleshooting and prevent outages. They share a few essentials.
Real-Time User Experience Monitoring
User experience is the metric that matters most, so monitoring should measure it directly—logon duration, application launch time, screen latency, and session responsiveness.
Infrastructure and Application Correlation
Strong VDI monitoring tools tie the session experience to application performance and the underlying infrastructure. When a desktop slows, the tool should point to the specific tier responsible.
AI-Based Root Cause Diagnosis
Manual correlation does not scale across thousands of sessions. Automated, intelligence-driven diagnosis analyzes every tier, filters out noise, and surfaces the underlying cause—cutting time to resolution.
Capacity Planning and Forecasting
Trend data on resource usage helps teams right-size hosts, plan for growth, and avoid peak-time contention. Learn more about predictive analytics, see: Predictive Analytics Models and Algorithms for IT Systems and Metrics | eG Innovations.
Automated Alerting and Reporting
Threshold-based, intelligent alerting flags problems before users call the helpdesk, while scheduled out-of-the-box reports give IT leaders a clear view of performance and service levels.
Why VDI Monitoring Is Important for Enterprises
Supporting Remote and Hybrid Workforces
For distributed teams, the virtual desktop is the digital workspace. If it is slow or unavailable, work stops—wherever the employee sits. Monitoring gives IT the visibility to support users it can’t reach in person.
Improving Employee Productivity
Every second lost to a slow logon or lagging session multiplies across an entire workforce. Keeping sessions responsive protects the productive hours an organization is paying for.
Reducing Helpdesk Tickets and Downtime
Proactive monitoring catches degradation before it becomes an outage, deflecting service desk tickets and shrinking diagnosis time on those that come in.
Ensuring Business Continuity
In sectors such as healthcare, finance, and government, virtual desktops run mission-critical workflows. Continuous monitoring helps keep those services available and performing.
Best Practices for Effective VDI Monitoring

Monitor User Sessions End-to-End
Watch the full path from device through access tier, desktop, and back-end infrastructure. It is the only reliable way to separate a network problem from a storage problem when both look like “a slow desktop” to the end user.

Track Infrastructure Dependencies
Map how brokers, hypervisors, storage, network, and directory services depend on one another. Those relationships let monitoring trace a symptom to its source instead of flagging every affected tier.

Establish Performance Baselines
Define what “normal” looks like for logon times, resource usage, and session metrics. Choose monitoring tools that can auto-baseline metrics. Baselines let monitoring detect meaningful deviations early, rather than waiting for a hard threshold to be crossed.

Use Synthetic Monitoring for Proactive Detection
Simulated logons and transactions test the environment around the clock, including off-hours. Synthetic monitoring catches access and performance problems before real users hit them.
How eG Innovations Helps with VDI Monitoring
Deep Visibility Across VDI Infrastructure
eG Enterprise delivers single-pane-of-glass visibility into the entire VDI stack—desktops, hypervisor, network, and storage. It automatically discovers the dependencies between VDI tiers and supporting infrastructure (network, virtualization, Active Directory, storage, and cloud), so IT teams see the whole environment in one view.
End-to-End User Experience Analytics
eG Enterprise measures every aspect of the user experience—logon time, application launch time, frame rate, and connection bandwidth—using a combination of real-user and synthetic monitoring. It breaks the logon process into individual steps, from authentication to application launch, so administrators can isolate the stage causing slowness.
AI-Driven Root Cause Analysis
eG Enterprise auto-correlates performance across VDI and non-VDI tiers to isolate the root cause and reduce mean time to repair. Its coverage extends beyond native metrics to protocol health (Blast, PCoIP, EDT/HDX, RDP), hypervisor load, storage performance, and application behavior—so teams pinpoint the source instead of guessing.
Support for Citrix, Omnissa Horizon, Amazon Workspaces and Microsoft AVD
As a vendor-agnostic platform, eG Enterprise monitors Citrix, Omnissa Horizon, Microsoft AVD, and Amazon Workspaces sessions from a single console. Organizations running more than one VDI platform can standardize on a single monitoring approach.
Conclusion
Virtual desktops have become central to how modern organizations work, which makes VDI monitoring a requirement rather than a nice-to-have. The environments are multi-tier, and the cost of a slow desktop is measured in lost productivity across the whole workforce.
The path forward is monitoring that measures the user experience directly and correlates it with the infrastructure underneath—so IT teams find the root cause in minutes. With unified visibility across Citrix, Omnissa Horizon, Amazon Workspaces and Microsoft AVD, eG Enterprise gives organizations a single way to keep their virtual desktops performing.
AI Summary: VDI monitoring helps IT teams maintain virtual desktop performance by tracking user experience, infrastructure health, and application behavior. It identifies slow logons, latency, and resource bottlenecks, enabling faster troubleshooting, proactive issue detection, and consistent virtual desktop delivery across Citrix, Omnissa Horizon, Microsoft AVD, and Amazon WorkSpaces.
eG Enterprise is an Observability solution for Modern IT. Monitor digital workspaces,
web applications, SaaS services, cloud and containers from a single pane of glass.
 Venkat Narayanan is Head of Marketing at eG Innovations, focused on B2B SaaS growth, go-to-market strategy, and demand generation. He writes about AIOps, IT operations, and practical marketing execution.
