



It is 2 a.m. The pager goes off. Checkout is down, customers are dropping, and you have five dashboards open across four tools that do not agree. One says the application is fine. Another says latency is climbing. None tells you why.
This is the moment that decides whether you have the right application performance monitoring tool. Modern applications run across containers, cloud services, APIs, and infrastructure spanning on-premises and multiple clouds. A failure in one layer often masquerades as a problem in another.
Application visibility is now a business continuity question. When a service slows, revenue and customer trust erode in real time, often before an alert fires. That is driving a shift from reactive monitoring to proactive observability: seeing degradation coming and acting before users feel it.
What Is an Application Performance Monitoring (APM) Tool?
Definition and Core Purpose
An application performance monitoring tool measures how well your applications run and helps you find and fix problems that hurt performance or availability. Its purpose is simple to state and hard to deliver: tell you what is slow, why, and where to fix it, before the business is affected.
How APM Tools Work
APM platforms collect telemetry from inside and around your applications: instrumenting code to capture transactions, often watching the infrastructure underneath, and observing real users. That data is correlated and baselined so deviations stand out, turning raw signals into clear answers.
Key Metrics Collected by APM Platforms
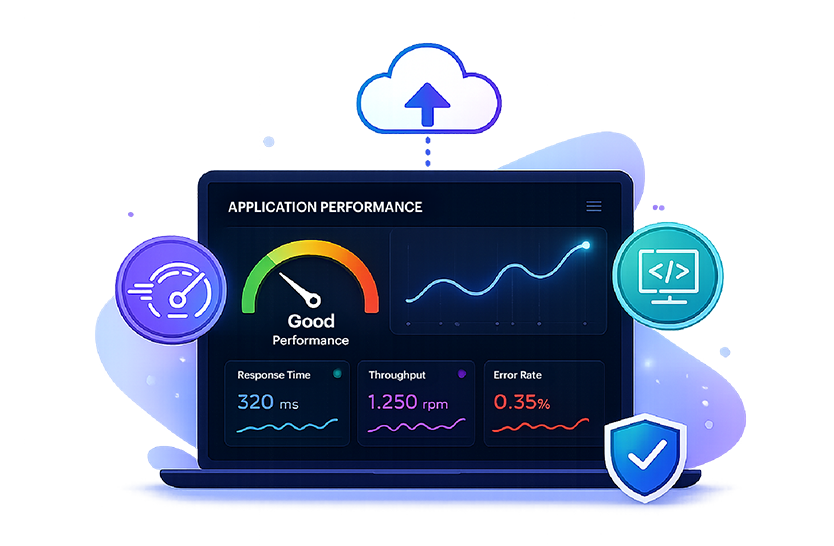
Most platforms track a consistent set of signals that describe application health:
- Response time: how long a request takes to complete, measured end to end and per tier.
- Throughput: the volume of requests or transactions handled over a period.
- Error rates: the share of requests that fail, time out, or return faults.
- User transactions: the real journeys, such as login or checkout, that map to business outcomes.
Together, these show not just that something changed, but whether it matters.
Why Businesses Need Application Performance Monitoring Tools
Detecting Performance Bottlenecks Faster
When a transaction slows, the cause could sit in code, a database query, a third-party API, or the infrastructure underneath. The right application performance monitoring tool narrows that search from hours to minutes, which means lower mean time to resolution. Digital experience monitoring enables businesses to enhance application performance, and proactively address issues, ultimately driving improved customer satisfaction and business outcomes.
Improving User Experience Across Applications
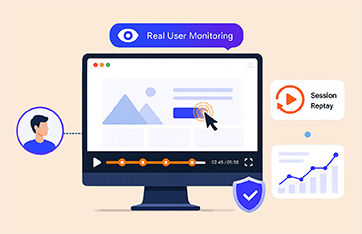
Users do not care about server CPU or cloud infrastructure performance. They care whether the page loads and the transaction completes. Application monitoring tools that measure the user’s experience catch slow pages and regional issues that backend metrics miss. APM features such as session replay also allow businesses to gain valuable insights into customer behavior.
Reducing Downtime and Service Disruptions
Downtime is expensive, and partial degradation can be worse because it is harder to spot. Intelligent baselines flag abnormal behavior early, so teams act before a slowdown becomes an outage. Even a slight delay in page load time translates into lost revenue, poor customer satisfaction and negative brand impact. For example:
- As explained in a blog by GigaSpaces, a one second increase in page load time for Amazon translates into a 1% drop in sales (about $1.6 billion in sales annually).
- Google found that a delay of 0.5 seconds in search page load time dropped traffic by 20%.
Supporting Hybrid and Cloud-Native Applications
Workloads can span physical servers, virtual machines, containers, private cloud, and public cloud at once. Effective transaction tracing follows a transaction wherever it runs, without losing the thread.
Key Features of the Best Application Performance Monitoring Tools
Real-Time Transaction Monitoring
See transactions as they happen, not in a report the next morning. Real-time monitoring surfaces slow or failing transactions while you can still act on them.
Distributed Tracing for Microservices
In a microservices architecture, one request can touch dozens of services. Distributed tracing follows it across every hop, showing where time is spent and where it breaks. OpenTelemetry has emerged as the open standard for instrumentation and trace-context propagation, which matters to teams avoiding vendor lock-in.
AI-Powered Root Cause Analysis
Dashboards show symptoms. Root cause analysis explains them. AI and machine learning learn normal behavior, detect anomalies automatically, and correlate related events so the real cause is not buried under downstream alerts.
Infrastructure and Application Correlation
An application slowdown is often an infrastructure problem in disguise. Correlating application metrics with the servers, clouds, databases, storage, and network beneath them separates a guess from an answer.
Digital Experience Monitoring
Digital experience monitoring combines real user monitoring, which captures actual sessions, with synthetic monitoring, which runs scripted tests around the clock. Together they tell you how the application feels to real users in every location.
Challenges in Application Performance Monitoring
Monitoring Multi-Cloud Environments
Each cloud has its own native tools, metrics, and blind spots. Stitching them into one coherent view is hard, and the gaps between them are exactly where problems hide. Learn more about the requirements for effective cloud monitoring, see: White Paper | Top 10 Requirements for Performance Monitoring of Cloud Applications and Infrastructures.
Handling Dynamic Microservices Architectures
Containers and services scale up, move, and disappear within minutes. Monitoring has to keep pace and map dependencies that change constantly. APM monitoring tools must auto-deploy and auto-discover alongside the technologies they monitor.
Identifying Root Causes Across Dependencies
Modern applications depend on long chains of services and infrastructure. When one link degrades, symptoms appear everywhere, and isolating the true cause is the central difficulty of APM.
Alert Fatigue and Noise Reduction
When every tool alerts independently, a single incident generates hundreds of notifications (an alert storm), and the one that matters gets lost. Reducing noise through correlation and intelligent baselining is now a core requirement.
Limitations of Distributed Tracing
While distributed tracing is a powerful technique for monitoring and analyzing the performance of distributed systems, there are some limitations to what it can do. Here are some scenarios where distributed tracing may not be enough:
- Not all tracing tools provide automatic instrumentation: Distributed tracing is intended to save teams time and effort; however, some tools require developers to manually instrument or adjust their code to configure distributed tracing requests. This can be time-consuming and can result in code errors.
- Tracing is not enough on its own: Distributed tracing provides visibility into the performance of individual components of a distributed system, but it may not provide enough context to understand the system. For example, distributed tracing may not capture the impact of network latency or infrastructure bottlenecks that affect the system’s performance.
- Limited to backend coverage: Many tools do not take an end-to-end approach to distributed tracing and only generate a trace ID for a request when it reaches the first back-end service, losing information pertaining to the user session on the frontend.
Costs
The licensing models of APM tools varies wildly and costs can be prohibitive at scale. Pricing models based on a per transaction basis or resource configurations (e.g. size of server) can prove particularly challenging for many organizations to deploy at the scales they need for effective full-coverage visibility of all their apps. Many APM products require additional modules to provide functionality such as infrastructure or database monitoring which can also inflate costs.
Best Practices for Implementing APM Tools
Define Critical Business Transactions
Monitor End-User ExperienceInstrument the experience, not just the backend. Combine real user and synthetic monitoring so you know how the application performs for actual users and can catch issues before they report them.
Integrate Infrastructure and Application Monitoring
Do not monitor applications and infrastructure in separate tools. When the two are correlated in one place, you can trace a slow transaction straight down to the resource causing it.
Use Automation for Faster Remediation
Automation closes the gap between detection and resolution. Automated diagnosis and remediation at the infrastructure and server level can resolve common issues before someone has to wake up.
How eG Innovations Delivers Advanced APM
End-to-End Application Visibility
eG Enterprise gives IT teams a single, unified view spanning the application and the infrastructure it runs on. Instead of switching between tools, you see the entire transaction path in one console, which turns a 2 a.m. scramble into a quick, confident fix. Its digital experience monitoring adds real user and synthetic monitoring, Core Web Vitals, and session replay to reconstruct a user’s full journey.
Full Stack Monitoring and Correlation
eG Enterprise monitors 650+ applications and technologies out of the box, from databases, Java, .NET, and PHP to SAP, Oracle, Docker, Kubernetes, and Citrix. It correlates application performance with the underlying physical, virtual, cloud, and hybrid infrastructure, so a slowdown is traced to its real cause rather than its loudest symptom.
AI-Driven Performance Analytics
Using AIOps with machine-learning auto-baselining and anomaly detection, eG Enterprise learns what normal looks like for your environment and flags deviations early. Predictive forecasting supports capacity planning, helping you right-size resources before demand outpaces them.
Cross-Tier Dependency Mapping
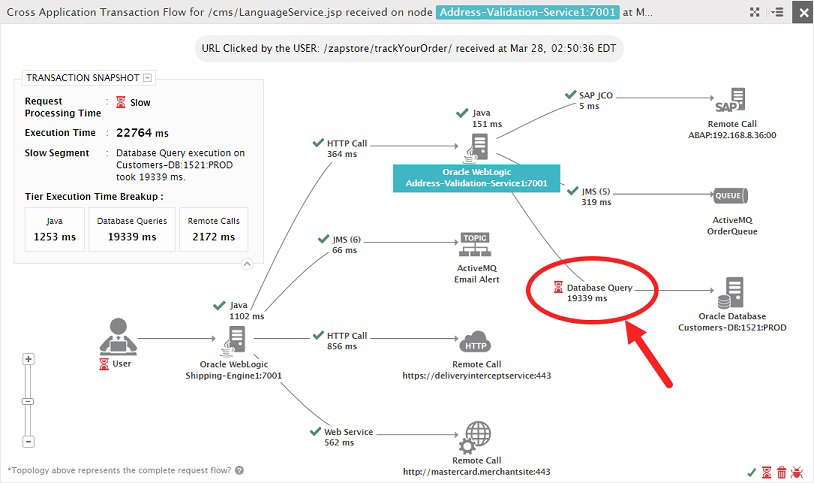
eG Enterprise traces each transaction through every tier using byte-code instrumentation with a tag-and-follow approach, with no application code changes. eG Enterprise gives a complete visualization of the transaction flow across every tier of the application architecture (web server, application server, database, message queues, and remote calls).
It pinpoints the responsible Java method, SQL query, or external API call and builds the dependency map automatically, keeping that picture accurate as the environment changes.
Application Discovery & Dependency Mapping
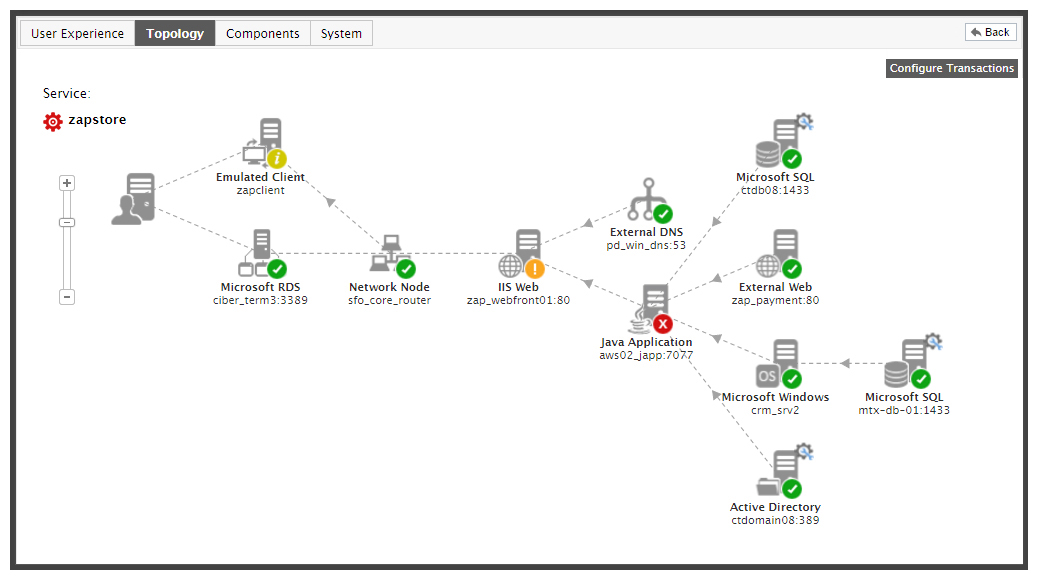
eG Enterprise will automatically discover and visualize application topologies, showing real-time service dependencies across cloud, container, virtual, and on-premises infrastructures. It uses AI-assisted root cause diagnosis technology to accurately pinpoint the reason for application slowness. eG Enterprise will also correlate front-end slowness with API latency, database query times, and container resource exhaustion.
Application Analytics & Reporting
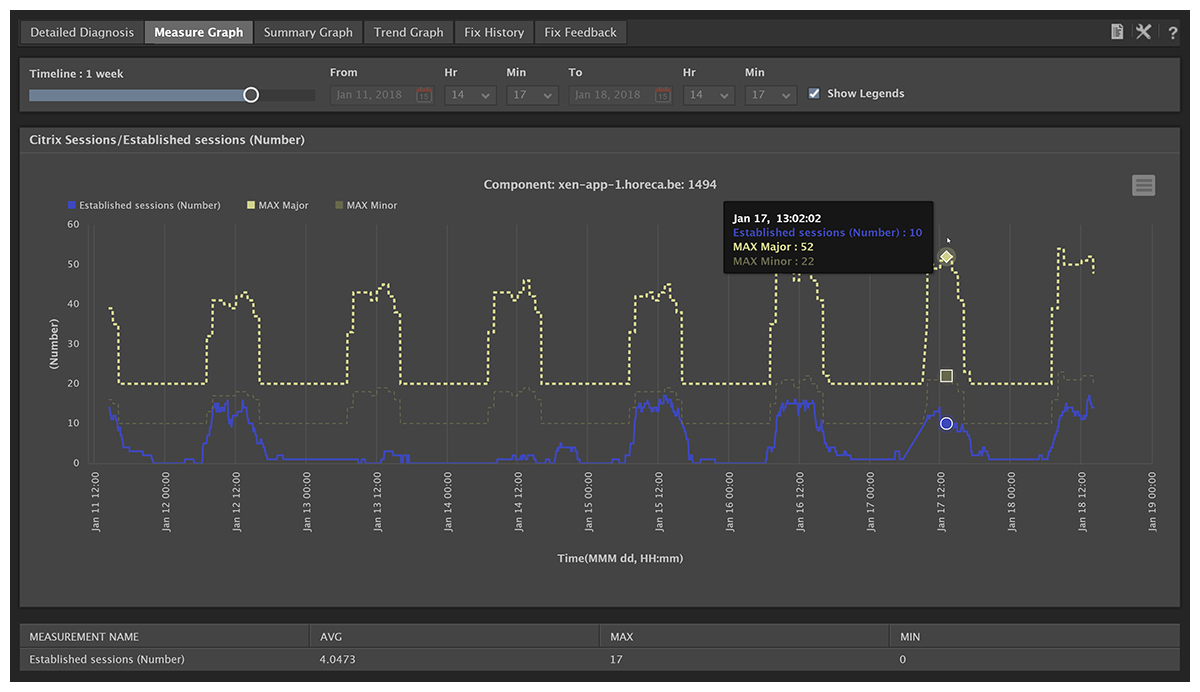
eG Enterprise gives actionable insights through intelligent alerting, anomaly detection, and adaptive baselining powered by self-learning. The built-in analytics dashboards help surface trends, patterns, and emerging risks across the IT landscape. You can use them out-of-the-box and customizable reports for historical analysis, capacity forecasting, cost optimization, right-sizing, auditing, and executive-level visibility. This enables data-driven decisions by IT and business stakeholders.
Learn more about eG Enterprise’s predictive analytics, see: Predictive Analytics Models and Algorithms for IT Systems and Metrics | eG Innovations.
Cost-effective, Flexible APM
eG Enterprise’s unique features include a simple and predictable licensing model based on technologies and applications monitored (not by volume of transactions or resource configuration) and flexible deployment – on-premises or cloud-based.
Conclusion: Choosing the Best Application Performance Monitoring Tool
The right application performance monitoring tool is the difference between guessing at 2 a.m. and knowing. When applications and infrastructure are unified in one view, you stop chasing symptoms across disconnected dashboards and start fixing root causes fast.
To see what end-to-end APM looks like in practice, look at how eG Enterprise correlates application performance with the full stack beneath it. Better to see the whole picture before your next incident, not during it.
eG Enterprise is an Observability solution for Modern IT. Monitor digital workspaces,
web applications, SaaS services, cloud and containers from a single pane of glass.
Frequently Asked Questions
An application performance monitoring tool measures how well your applications perform and helps teams fix problems affecting speed, availability, and user experience. It collects metrics like response time, throughput, and error rates, then correlates them so teams can detect issues and find root causes quickly.
Application monitoring tools instrument application code, watch the supporting infrastructure, and observe real user activity. They gather telemetry across these layers, baseline normal behavior, and analyze deviations. By correlating signals from every tier, they pinpoint where a problem originates, not just where symptoms appear.
APM focuses on measuring application performance through predefined metrics and transactions. Observability is broader, using metrics, logs, and traces to understand a system's internal state, including conditions you did not anticipate. In practice, modern APM platforms increasingly include observability capabilities for deeper, more flexible analysis.
Cloud applications run across distributed, often multi-cloud environments where components scale and move constantly. APM gives you visibility into that complexity, tracing transactions wherever they run and correlating performance with cloud infrastructure. Without it, problems hide in the gaps between services and cloud-native tools.
Any industry that depends on digital services benefits, especially those with mission-critical applications. Healthcare, finance, banking, government, manufacturing, and education all rely on APM to keep core systems performing. The more revenue depends on application uptime, the greater the value of APM.