A few months ago, I wrote an article about a serious outage of Azure and how eG Enterprise enabled us and our customers to understand the issue long before Microsoft had confirmed the issue and updated their service status pages. Recently another very significant outage occurred between 07:05 UTC and 09:45 UTC on 25th January 2023, manifesting as network latency and/or timeouts when attempting to connect to Azure resources in Public Azure regions, as well as other Microsoft services including M365 and Power BI. Postmortem information on this is trickling out on Microsoft Azure’s status history page under the reference “Tracking ID VSG1-B90″.
During this incident, Microsoft 365 / Office 365 was affected, and Azure-based services Outlook, Teams and Exchange services and Azure users’ ability to access Azure native monitoring such as Log Analytics and Azure Monitor were impacted.
How do you notify your employees of a known service incident when they cannot access Teams or Outlook? What if you cannot access Azure Monitor?
In this article, I will walk-through the incident and the tools that enabled our own system administrators to detect the issue, determine the extent of the issue and rapidly issue notifications internally to pre-empt users calling our help desk staff and raising unnecessary IT support tickets – all long before Microsoft had confirmed the issue or updated their own public service status services. I will also be including graphs of certain metrics to show what a Microsoft Azure outage may look like from the outside.
Signs of Azure problems
On Wednesday 23rd January 2023 at around 07:10 UTC, Microsoft experienced severe and widespread issues with Azure, affecting a large number of users and impacting core business services and applications that many organizations cannot function without, Outlook, SharePoint and Teams were affected. Many businesses and organizations simply cannot function without email or phone and video facilities. The timing at the start of the working day in Europe and the UK and around lunchtime in India meant the outage was highly visible and users and administrators rapidly turned to social media as the Azure status pages still indicated that all was OK.
The first indication of an issue from Microsoft was a tweet on the Microsoft 365 Status (@MSFT365Status) / Twitter account at 07:31 AM saying “We’re investigating issues impacting multiple Microsoft 365 services. More info can be found in the admin center under MO502273”.
A Service Health Status update from Microsoft at 08:10 UTC admitted that: “Users may be unable to access multiple Microsoft 365 services,” which include but were not limited to Teams, Exchange Online, Outlook, SharePoint Online, and OneDrive for Business.
And at 08:15 AM the @MSFT365Status account confirmed the issue was (probably) a wider issue in the underlying Azure networking stack, stating “We’ve identified a potential networking issue and are reviewing telemetry to determine the next troubleshooting steps. You can find additional information on our status page at https://msft.it/6011eAYPc or on SHD under MO502273.”
In reality, many more services such as Azure VPN and Power BI were affected as well as services dependent on Azure such as GitHub. The incident was so impactful to end-users that the outage was covered by many national news organizations, such as the BBC (https://www.bbc.com/news/technology-64397643), CNN (Microsoft cloud outage hits users around the world | CNN Business), Reuters (Microsoft cloud outage hits users around the world | Reuters) and The Register (Global network outage hits Azure, Teams, Outlook • The Register).
In the hour between the problems starting and confirmation by Microsoft of the issue, it is likely that many IT help desks were deluged with support calls and IT tickets as users found themselves unable to use email or make Teams calls. Many administrators took to twitter, Reddit or third-party outage tracking sites such as Downdetector. While this helped many guess that there was indeed (probably) an issue, it didn’t give those administrators a true picture of the extent or impact on their own business and users.
At eG Innovations, this was not the case as we use our own eG Enterprise observability platform and monitoring tools to track key application and service performance and availability. Our IT team rapidly notified all employees of the issue, avoiding anxiety for them and stopping a lot of unnecessary support tickets and calls for the IT team to process.
Key Considerations for Detecting and Monitoring Cloud Services
This incident has highlighted many of the features we leverage in eG Enterprise and best practice workflows we have implemented to ensure that cloud service outages are detected and our employees are notified even when Outlook and Teams are down, including:
- Using Synthetic monitoring, robots regularly and continuously simulate users accessing the M365 office apps we use from multiple users, even at times of the day when real users are unlikely to be active (this outage happened at around 3am EST so many US based organizations may not have noticed if relying on real user data only). The article, Synthetic Monitoring of Microsoft Azure DaaS (Desktop as a Service) may be of interest.
- Ensure a cloud service such as Azure is monitored from infrastructure external to Azure, on-prem or from an alternative public cloud such as Amazon AWS (Amazon Web Service). Those already leveraging services from multiple clouds may like to explore our recent article on considerations for monitoring multi-cloud architectures, see: Monitoring and Troubleshooting Multi-cloud Infrastructures (eginnovations.com).
- Ensure your eG Enterprise deployment takes full advantage of the failover features available, especially if hosted on cloud infrastructure itself. The high-availability features of eG Enterprise are covered in Making Migration of a Monitoring Tool Easy By Leveraging High-Availability Features.
- Don’t rely on email or Teams alone to notify employees or customers. How will your users find out about service outages if they cannot access their email or Teams? Consider using the eG Enterprise Mobile App, SMS, or our ITSM integrations with products such as WhatsApp, JIRA, ServiceNow and so on. eG Enterprise can be integrated with multiple ITSM systems. Consider publishing eG Enterprise dashboards monitoring key services. In call center type environments, dashboards displayed on large screens via TV/Kiosk mode may be appropriate.
- For email alerts use a system external to the infrastructure being monitored. Our monitoring of Azure services such as M365 used by our employees uses AWS hosted SES (Simple Email Service) to ensure notification emails are sent out. Remember to configure a backup email server within eG Enterprise (see: Configuring a Backup Mail Server (eginnovations.com))
How eG Enterprise helps Monitor Azure Performance and Availability
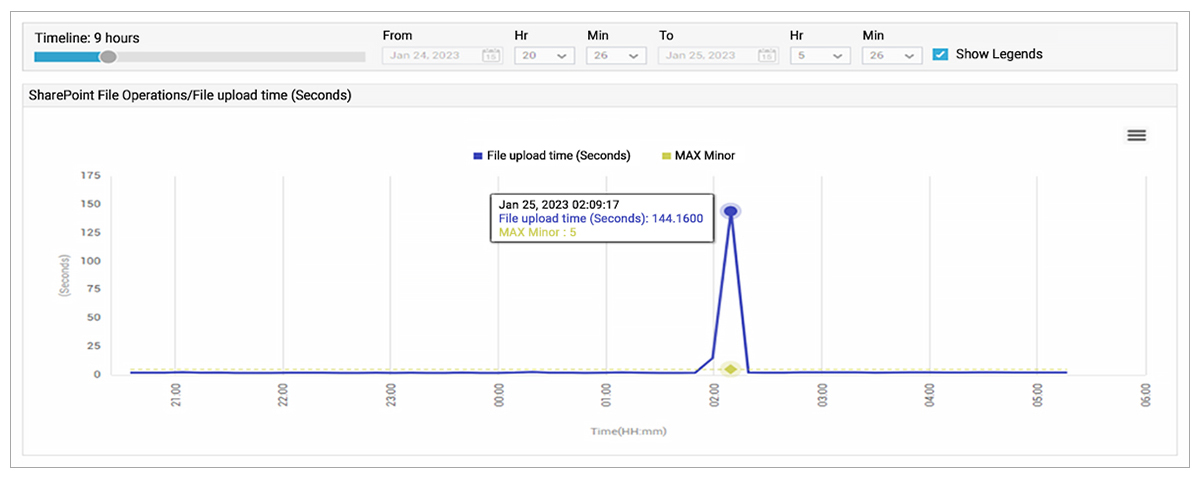
Our IT team first started seeing issues with our O365 apps between 07:15 and 07:45 (note the console from which I have taken the screenshots in in EST, i.e., 07:00 UTC is equivalent to 02:00 EST.).
As the underlying cause was a network issue, there were a range of problems experienced by users, some experienced slow and sluggish performance, those not already logged in could not log onto O365, some of those logged in could not access Outlook.
Under-the-hood within eG Enterprise thousands of metrics, events, logs and traces are continually monitored. Out-of-the-box dynamic and static thresholds test these metrics and signals and when breached alarms are correlated to identify root causes and alerts raised. Alerts are or can be configured to be raised:
- To the alarm window accessible via web console or mobile app, the mobile app can be particularly useful in certain scenarios where the administrator’s local network (LAN) or Wi-Fi access fails on larger campuses or sites
- Upon dashboards
- Via email, SMS text messages, to browsers or direct to ITSM help desk tools such as ServiceNow, JIRA or Teams (in this case an alert via Teams probably wouldn’t have been helpful though)
- To the eG Enterprise Mobile Apps for iOS and Android
For public clouds and enterprise applications such as PeopleSoft, SAP and Office 365 we have dedicated integrations that capture the metrics, notifications and signals made available by the software vendors beyond those metrics we also capture about the hardware, cloud infrastructure, networking, operating systems and software the applications run upon. For Azure, this means we leverage their APIs to collect Service Statuses and Incident alerts automatically; admins do not spend their days pro-actively checking the Azure Status website in case there is an issue.
We continually check for information from Azure on outages which are then highlighted to the administrator on dashboards and alarm windows; without the need to log on to Azure – particularly useful if Azure services are intermittent.
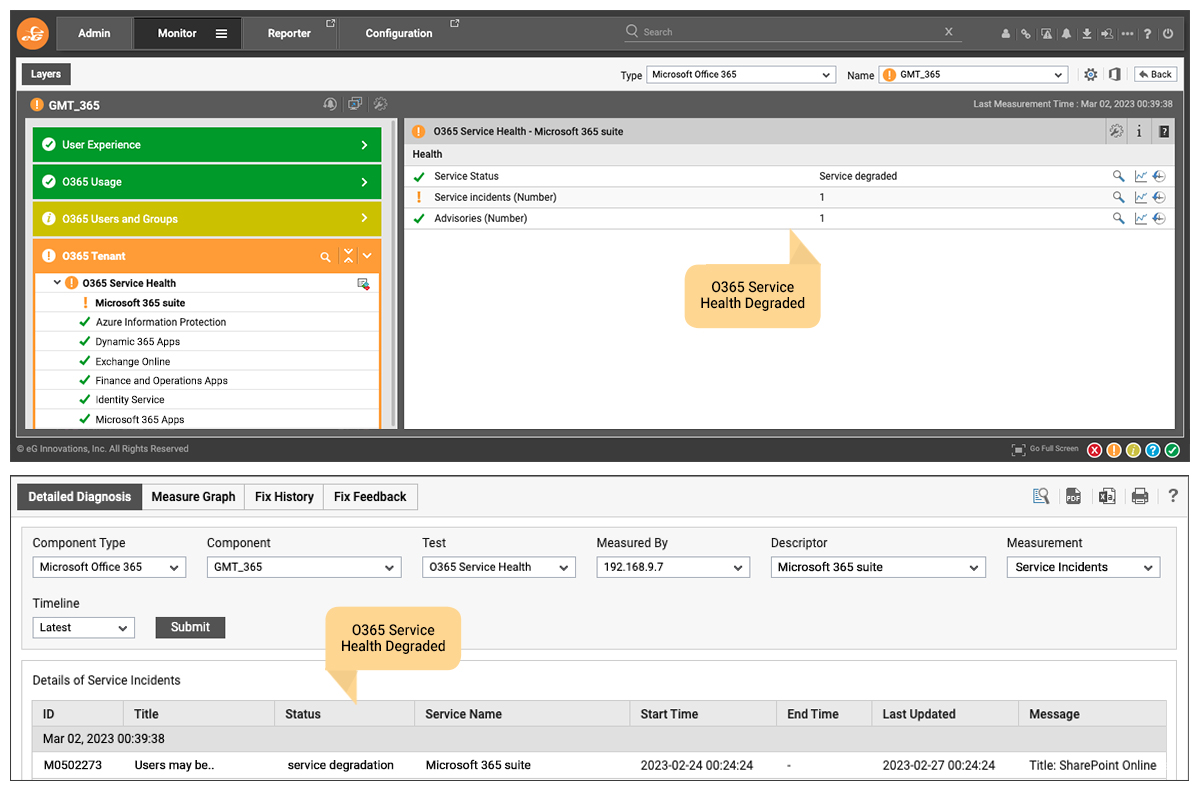
Although the public website did not get updated until 08:10, Microsoft did start issuing alerts via their programmatic interfaces earlier as can be seen in Figure 1. At this time, many users were affected, and alerts raised due to user-experience metric thresholds being breached. The AIOps (Artificial Intelligence for Operations) driven alert correlation technologies within eG Enterprise ensured those alerts were suppressed and the root-cause issue prioritized, avoiding alert storms – note how the issues in the O365 layer are orange whilst those in User and Groups layer are only yellow. This color-coded guidance allows administrators to differentiate secondary symptoms from the true root cause of issues.
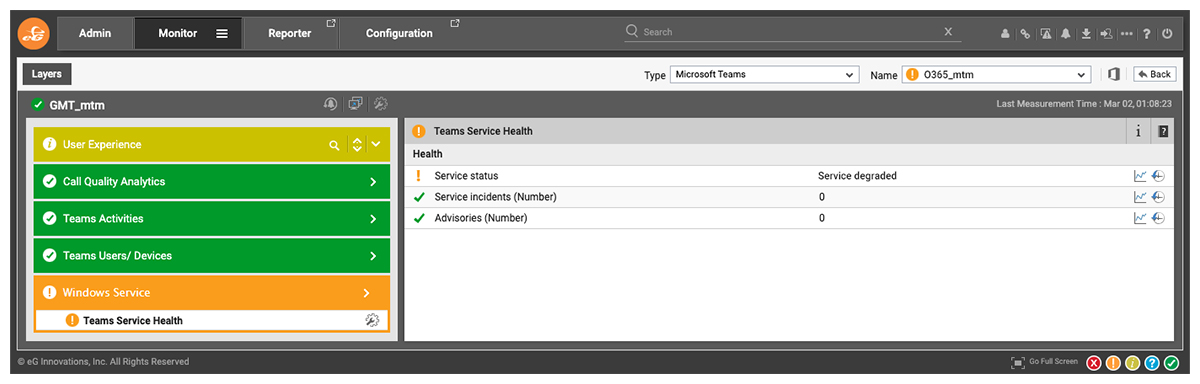
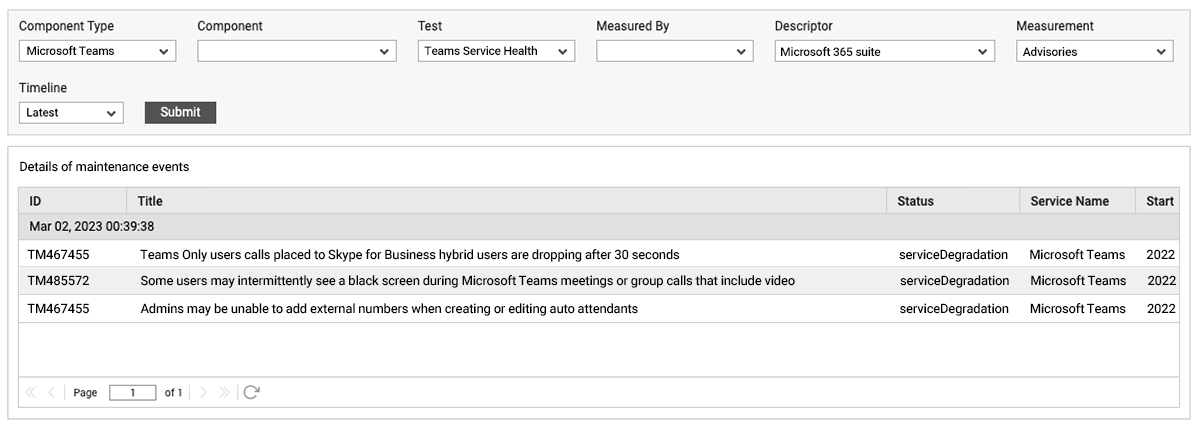
When service incidents or advisories are available from Microsoft, eG Enterprise collects detailed information which can be accessed via the detailed diagnosis icon (the magnifying glass) that appears on the right-hand side of the screen as in Figure 2. Clicking on this icon accesses those details, see Figure 3.
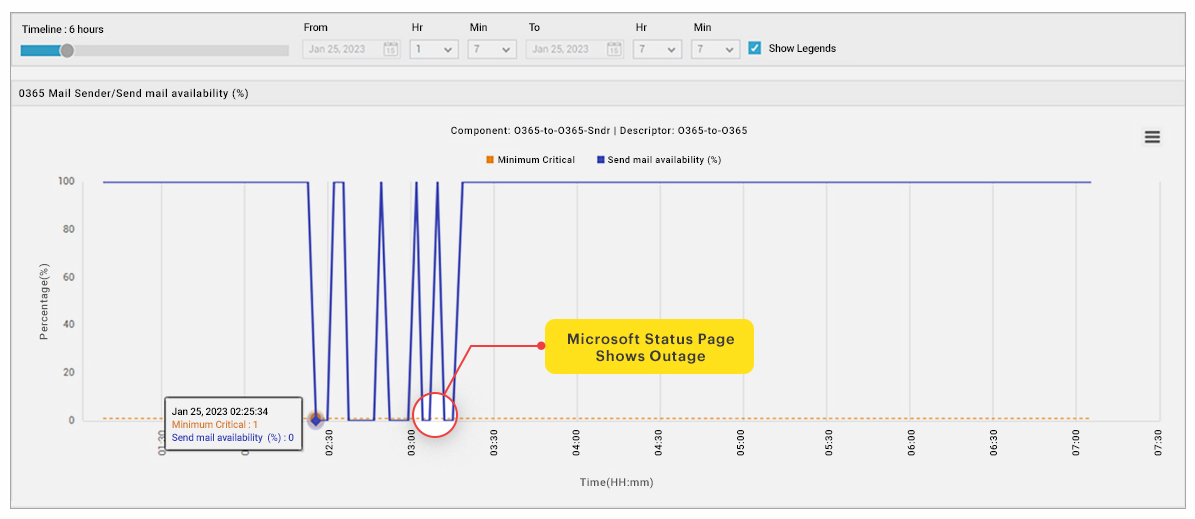
We also have our internal implementation of eG Enterprise configured to perform synthetic monitoring whereby “robot” users simulate repeatedly logging on and utilizing key applications to test they are available and usable even when there are no real users using a system. This often detects issues before users log on at the start of a working day. These tests started to fail at 07:21 AM. The issue showed up in numerous synthetic tests for Teams, Exchange and Outlook app availability.
Microsoft’s Analysis To-Date
Microsoft issued a preliminary analysis within a day.
Preliminary Root Cause: We determined that a change made to the Microsoft Wide Area Network (WAN) impacted connectivity between clients on the internet to Azure, connectivity between services within regions, as well as ExpressRoute connections.
Mitigation: We identified a recent change to WAN as the underlying cause and have rolled back this change. Networking telemetry shows recovery from 09:00 UTC onwards across all regions and services, with the final networking equipment recovering at 09:35 UTC. Most impacted Microsoft services automatically recovered once network connectivity was restored, and we worked to recover the remaining impacted services.
A full breakdown of the incident followed, see: Azure status history | Microsoft Azure. The short answer is: human error not following the process to check and release a change that wasn’t blocked by automated processes.
Final Thoughts
As ever Azure Community expert, Marius Sandu was one of the first on social media to raise and confirm this latest incident and did an excellent job directing the community to the official Microsoft information. I would recommend following him at Marius Sandbu (@msandbu) / Twitter in addition to the official Microsoft M365 status account, Microsoft 365 Status (@MSFT365Status) / Twitter.
This is only the most recent of a series of Microsoft Azure outages which include one in December that also affected cloud services such as Exchange Online and Teams across the Asia-Pacific region, and another Microsoft Azure outage in July which affected Microsoft 365 services globally, plus the September Microsoft Azure outage that affected AVD (Azure Virtual Desktop) and Azure AD.
Enterprises really do need to factor in cloud outages and how they design their monitoring to detect these, to continue to function without depending on certain clouds and how they proactively notify users even when email and Teams are down!
Update 29/March/2023 – Since writing this article, I have written another elaborating on practical steps to implement a resilient monitoring strategy to ensure visibility on and during cloud outages, see: How to Protect your IT Ops from Cloud Outages (eginnovations.com).
eG Enterprise is an Observability solution for Modern IT. Monitor digital workspaces,
web applications, SaaS services, cloud and containers from a single pane of glass.
Further Information
- Some commentators even covered how common incidents such as the 25th of January are, see: Microsoft 365 Outage of January 2023 is Just a Blip in the Cloud (practical365.com).
- If you enjoyed this postmortem blog post – you may enjoy this similar one, Troubleshooting Web Application Performance & SSL (Secure Socket Layer) Issues
- Or a more complex performance issue postmortem on Amazon’s AWS (Amazon Web Service) cloud, Application Performance Troubleshooting on AWS Cloud: A Case Study (eginnovations.com)
- Learn more about synthetic monitoring tools: Synthetic Monitoring & Synthetic Transaction Monitoring Tools (eginnovations.com)
- Learn about end-to-end observability for Azure: Azure Cloud Monitoring Tools & Solutions | eG Innovations
- Find out about our enterprise application monitoring capabilities for Office 365 Monitoring Made Easy | eG Innovations or Microsoft Teams Monitoring – Tools & Strategies (eginnovations.com)
 Rachel has worked as developer, product manager and marketing manager at Cloud, EUC, application and hardware vendors such as Citrix, IBM, NVIDIA and Siemens PLM. Rachel now works on technical content and engineering and partner liaison for eG Enterprise.