The eG .NET Business Transaction Monitor (BTM)
The eG .NET BTM employs an advanced ‘tag-and-follow’ technique to trace the path of each business transaction to a .NET application hosted on an IIS web server. When doing so, it auto-discovers the CLRs the transaction travels through, and also automatically ascertains what remote service calls were made by the transaction when communicating with the CLRs. In the process, the eG .NET BTM measures the following:
- The total response time of each transaction;
- The time spent by the transaction on each CLR node in the path;
- The time spent by the transaction for processing every external service call (including SQL queries);
The eG .NET BTM is also capable of tracing a transaction across hybrid Java and .NET architectures. For instance, if a transaction request to a .NET application makes an HTTP or a Web services call to a Java application, then the eG .NET BTM is capable of discovering this relationship.
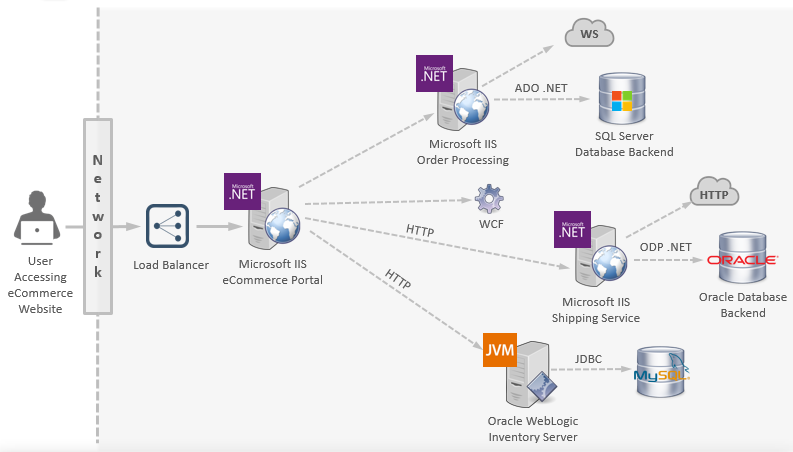
Figure 1 : Tracing a .NET transaction
Using these analytics, the eG .NET BTM precisely pinpoints the slow, stalled, and failed transactions to the .NET application, enables administrators to accurately isolate where – i.e., on which IIS web server – the transaction was bottlenecked, and helps them figure out exactly what caused the bottleneck – an inefficient or errored query to the database? a slow HTTP/S call to another web / web application server? an issue in asynchronous communication with another server over WCF? a sluggish web service call? or an error in the application code? By quickly leading administrators to the source of transaction failures and delays, the eG .NET BTM facilitates rapid problem resolution, which in turn results in the low downtime of and high user satisfaction with the .NET application.