Monitoring AWS Elastic Kubernetes Service
As mentioned earlier, eG Enterprise provides a specialized model for monitoring AWS Elastic Kubernetes Service (see Figure 1).
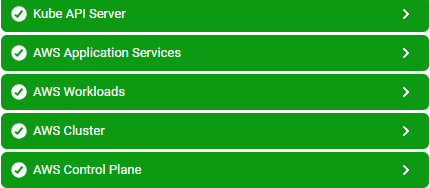
Figure 1 : Layer model of AWS Elastic Kubernetes Service
Each layer of Figure 1 is mapped to tests that report a wide variety of status metrics - e.g., node status, Pod status, Daemonset status, etc. - thus bringing abnormalities to the attention of administrators. Using these metrics, administrators can find quick and accurate answers to the following performance queries:
-
Is the Kubernetes API server available?
-
Are any nodes running Daemonsets they should not?
-
Are any nodes not running the Daemonsets they should?
-
Are all Deployments healthy? If not, which are the Deployments that failed to create the desired number of Pod replicas?
-
Is any Deployment unavailable?
-
Has any Deployment failed to update all desired Pod replicas with changes to the Pod template?
-
Are backoff conditions not allowing any Horizontal Pod autoscaler to perform scaling?
-
Is any autoscaler unable to compute scales? If so, why?
-
Has the scaling ability of any autoscaler been inhibited by the replica limits set?
-
Has the target utilization level for scaling been set correctly for all autoscalers?
-
Did any autoscaler fail to scale the current replica count to the desired levels?
-
Have any Jobs failed in a namespace? Which one is it?
-
Are all Pods in a namespace, which were created by Jobs, running?
-
Did any Job take too long to run? If so, which one is it?
-
Are all nodes running? Which nodes are not running?
-
Has any node been marked as 'unschedulable'? If so, which one?
-
Is any node in a bad condition? If so, why? Is it because of a network misconfiguration? insufficient disk space? low memory? process pressure?
-
Are all nodes ready to accept Pods? Which are the ones that are not ready?
-
Is any node running to full Pod capacity?
-
Are any node's resources been overcommitted? If so, which resource (CPU or memory) has been overcommitted, and which Pods on the nodes are over-subscribing to that resource?
-
Is any node running out of CPU or memory resources?
-
How many master and worker nodes does the cluster have?
-
Are there any Pending Pods in the cluster? Which are they?
-
Have any Pods in the cluster failed?
-
Is the write-through cache of the ETCD used optimally?
-
Are Golang collectors spending too much time in garbage collection?
-
Are all key master services up and running?
-
Are any namespaces terminating?
-
Has any namespace exhausted or is about to exhaust its quota of Pods and/or services?
-
Is the (CPU and/or memory) resource quota of any namespace nearing exhaustion?
-
Are there any free Persistent Volumes, or are all of them bound to a claim?
-
Has any Persistent Volume failed automatic reclamation?
-
How many Pods in a namespace are ready to serve requests? Which ones are they?
-
Which Pod is in what phase of its lifecycle?
-
Are there any Pods with containers that are not ready to service requests?
-
Which Pods are not yet scheduled to nodes, and why?
-
Does any Pod have containers that terminated abnormally? If so, which containers and which Pod terminated so, and why?
-
Are any Services in a namespace in a Pending state currently? If so, why?
-
Have any failure/problem events been detected recently in the Azure Kubernetes Service cluster? What events are those - did Pod creation fail? did any containers get killed? did Pods get evicted? did any nodes run out of resources? did auto-scaling fail for any HPA? When did such events occur, why, and which nodes and Pods were impacted?