Processes - OS Test
Application processes can be identified based on specific regular expression patterns. For example, web server processes can be identified by the pattern *httpd*, while DNS server processes can be specified by the pattern *named* where * denotes zero or more characters. For each such pattern, this test reports a variety of CPU and memory statistics.
Target of the test : A RHEV Hypervisor/RHEV Hypervisor - VDI
Agent deploying the test : A remote agent
Outputs of the test : One set of results per process pattern specified.
| Parameter | Description |
|---|---|
|
Test period |
How often should the test be executed. |
|
Host |
The host for which the test is to be configured. |
|
RHEL MGR Host, |
To auto-discover the VMs on a target RHEV hypervisor and obtain the outside view of the performance of each VM, the eG agent needs to connect to the RHEV Manager that manages the target RHEV hypervisor. To enable the eG agent to obtain the outside view, you need to configure the test with the following:
If the RHEV hypervisor being monitored was discovered via an RHEV manager, then the IP address, port number, domain name, and user credentials of the RHEV manager used for discovery will be automatically displayed against the respective parameters. If the RHEV hypervisor being monitored was not discovered via an RHEV manager, but you still want to use an RHEV manager for obtaining the outside view, then, you can select any IP address of your choice from the RHEL MGR host list. By default, this list will be populated with the IP addresses/host names of all the RHEV managers that were configured for the purpose of discovering the RHEV hypervisors. If you select an RHEL MGR host from this list, then the corresponding port number, domain name, and user credentials will be automatically displayed against the respective parameters. On the other hand, if the RHEV manager that you want to use for metrics collection is not available in the RHEL MGR Host list, then, you can configure an RHEV manager on-the-fly by picking the Other option from the RHEL MGR Host list. An ADD THE RHEV MANAGER DETAILS window will then pop up. Refer to Configuring an RHEV Manager to Use for Monitoring the RHEV Hypervisor to know how to add an RHEV manager using this window. Once the RHEV manager is added, its IP address, port number, domain name and user credentials will be displayed against the corresponding parameters. |
|
Confirm Password |
Confirm the RHEL MGR Password by retyping it here. |
|
Process |
In the Process text box, enter a comma separated list of names:pattern pairs which identify the process(es) associated with the server being considered. processName is a string that will be used for display purposes only. processPattern is an expression of the form - *expr* or expr or *expr or expr* or *expr1*expr2*... or expr1*expr2, etc. A leading '*' signifies any number of leading characters, while a trailing '*' signifies any number of trailing characters. The pattern(s) used vary from one application to another and must be configured per application. For example, for an iPlanet application server (Nas_server), there are three processes named kcs, kjs, and kxs associated with the application server. For this server type, in the Process text box, enter "kcsProcess:*kcs*, kjsProcess:*kjs*, kxsProcess:*kxs*, where * denotes zero or more characters. Other special characters such as slashes (\) can also be used while defining the process pattern. For example, if a server’s root directory is /home/egurkha/apache and the server executable named httpd exists in the bin directory, then, the process pattern is “*/home/egurkha/apache/bin/httpd*”. Note: The Process parameter supports process patterns containing the ~ character. To determine the process pattern to use for your application, on Windows environments, look for the process name(s) in the Task Manager -> Processes selection. To determine the process pattern to use on Unix environments, use the ps command (e.g., the command "ps -e -o pid,args" can be used to determine the processes running on the target system; from this, choose the processes of interest to you.) Also, while monitoring processes on Windows, if the Wide parameter of this test is set to Yes, then your process patterns can include the full path to the process and/or the arguments supported by the process. For instance, your processpattern specification can be as follows: Terminal:C:\WINDOWS\System32\svchost -k DcomLaunch,Remote:C:\WINDOWS\system32\svchost.exe -k netsvcs To save the time and effort involved in such manual process specification, eG Enterprise offers an easy-to-use auto-configure option in the form of settings icon that is available next to the Process text box. Refer to Auto-configuring the Process Patterns to be Monitored to know how to use the auto-configure option. |
|
Wide |
On Windows environments, by default, the eG agent uses perfmon to search for the processes that match the configured patterns. Typically, a process definition in Windows includes the full path to the process, the process name, and process arguments (if any). Perfmon however scans the system only for process names that match the configured patterns – in other words, the process path and arguments are ignored by perfmon. This implies that if multiple processes on a Windows host have the same name as specified against processpattern, then perfmon will only be able to report the overall resource usage across all these processes; it will not provide any pointers to the exact process that is eroding the host’s resources. To understand this better, consider the following example. Typically, Windows represents any Java application executing on it as java.exe. Say, two Java applications are executing on a Windows host, but from different locations. If java.exe has been configured for monitoring, then by default, perfmon will report the availability and average resource usage of both the Java applications executing on the host. If say, one Java application goes down, then perfmon will not be able to indicate accurately which of the two Java applications is currently inaccessible. Therefore, to enable administrators to easily differentiate between processes with the same name, and to accurately determine which process is unavailable or resource-hungry, the eG agent should be configured to perform its process searches based on the process path and/or process arguments, and not just on the process name – in other words, the eG agent should be configured not to use perfmon. To achieve this, by default, the Wide parameter is set to Yes. This will instruct the eG agent to not use perfmon to search for the configured process patterns. Once this is done, then, you can proceed to configure a processpattern that includes the process arguments and/or the process path, in addition to the process name. For instance, if both the Remote Access Connection Manager service and the Terminal Services service on a Windows host, which share the same name – svchost - are to be monitored as two different processes, then your processpattern specification should be as follows: Terminal:C:\WINDOWS\System32\svchost -k DcomLaunch,Remote:C:\WINDOWS\system32\svchost.exe -k netsvcs You can also use wildcard characters, wherever required. For instance, in the above case, your processpattern can also be: Terminal:*svchost -k DcomLaunch,Remote:*svchost.exe -k netsvcs Similarly, to distinctly monitor two processes having the same name, but operating from different locations, your specification can be: JavaC:c:\javaapp\java.exe,JavaD:d:\app\java.exe Note:
However, administrators can set the Wide parameter to No to enable the eG agent to use perfmon to search for the processes that match the configured patterns. |
|
SSL |
If the RHEV manager to which the eG agent should connect is SSL-enabled, then set this flag to Yes. If not, set it to No. |
|
Ignore VMs Inside View |
Administrators of some high security RHEV environments might not have permissions to internally monitor one/more VMs. The eG agent can be configured to not obtain the 'inside view' of such ‘inaccessible’ VMs using the Ignore VMs Inside View parameter. Against this parameter, you can provide a comma-separated list of VM names, or VM name patterns, for which the inside view need not be obtained. For instance, your ignore VMs inside view specification can be: *xp,*lin*,win*,vista. Here, the * (asterisk) is used to denote leading and trailing spaces (as the case may be). By default, this parameter is set to none indicating that the eG agent obtains the inside view of all VMs on an RHEV host by default. Note: While performing VM discovery, the eG agent will not discover the operating system of the VMs configured in the Ignore VMs Inside View text box. |
|
Exclude VMs |
Administrators of some virtualized environments may not want to monitor some of their less-critical VMs - for instance, VM templates - both from 'outside' and from 'inside'. The eG agent in this case can be configured to completely exclude such VMs from its monitoring purview. To achieve this, provide a comma-separated list of VMs to be excluded from monitoring in the Exclude VMs text box. Instead of VMs, VM name patterns can also be provided here in a comma-separated list. For example, your Exclude VMs specification can be: *xp,*lin*,win*,vista. Here, the * (asterisk) is used to denote leading and trailing spaces (as the case may be). By default, this parameter is set to none indicating that the eG agent obtains the inside and outside views of all VMs on a virtual host by default. By providing a comma-separated list of VMs/VM name patterns in the Exclude VMs text box, you can make sure the eG agent stops collecting 'inside' and 'outside' view metrics for a configured set of VMs. |
|
Ignore WINNT |
By default, the eG agent does not support the inside view for VMs executing on Windows NT operating systems. Accordingly, the Ignore WINNT flag is set to Yes by default. |
|
Inside View Using |
By default, this test obtains the “inside view” of VMs using the eG VM Agent. Accordingly, the Inside view using flag is set to eG VM Agent by default. The eG VM Agent is a piece of software, which should be installed on every VM on a hypervisor. Every time the eG agent runs this test, it uses the eG VM Agent to pull relevant 'inside view' metrics from each VM. Once the metrics are collected, the eG agent then communicates with each VM agent and pulls these metrics, without requiring administrator privileges. Refer to Configuring the Remote Agent to Obtain the Inside View of VMs for more details on the eG VM Agent. |
|
Domain, Admin User, and Admin Password, and Confirm Password |
By default, these parameters are set to none. This is because, by default, the eG agent collects 'inside view' metrics using the eG VM agent on each VM. Domain administrator privileges need not be granted to the eG agent if it uses this default approach to obtain the 'inside view' of Windows VMs. |
|
Report By User |
While monitoring a RHEV Hypervisor, the Report By User flag is set to No by default, indicating that by default, the guest operating systems on the hypervisor are identified using the Hostname specified in the operating system. On the other hand, while monitoring a RHEV Hypervisor - VDI, this flag is set to Yes by default; this implies that in case of the VDI model, by default, the desktops will be identified using the login of the user who is accessing them. In other words, in VDI environments, this test will, by default, report measures for every username_on_virtualmachinename. |
|
Report Powered OS |
This flag becomes relevant only if the Report By User flag is set to ‘Yes’. If the Report Powered OS flag is set to Yes (which is the default setting), then this test will report measures for even those VMs that do not have any users logged in currently. Such guests will be identified by their virtualmachine name and not by the username_on_virtualmachinename. On the other hand, if the Report Powered OS flag is set to No, then this test will not report measures for those VMs to which no users are logged in currently. |
|
Exclude IP |
Typically, when performing VM discovery, the eG agent automatically discovers the operating system on which every VM runs, and all the IP addresses that each VM supports. If two are more VMs on a target server are in a VM cluster, then the eG agent will also auto-discover the cluster IP address. Since the cluster IP address is shared by all VMs in the cluster, this IP address will be in the discovery list of every VM in the cluster. In this case, if the eG agent attempts to obtain the 'inside view' of each VM in a cluster using their cluster IP address, incorrect metrics may be reported sometimes. To avoid this, you may want to instruct the eG agent to not use the cluster IP address when collecting 'inside view' metrics. For this, specify a comma-separated list of cluster IP addresses to be excluded in the Exclude IP text box. |
|
DD Frequency |
Refers to the frequency with which detailed diagnosis measures are to be generated for this test. The default is 1:1. This indicates that, by default, detailed measures will be generated every time this test runs, and also every time the test detects a problem. You can modify this frequency, if you so desire. Also, if you intend to disable the detailed diagnosis capability for this test, you can do so by specifying none against DD frequency. |
|
Detailed Diagnosis |
To make diagnosis more efficient and accurate, the eG Enterprise embeds an optional detailed diagnostic capability. With this capability, the eG agents can be configured to run detailed, more elaborate tests as and when specific problems are detected. To enable the detailed diagnosis capability of this test for a particular server, choose the On option. To disable the capability, click on the Off option. The option to selectively enable/disable the detailed diagnosis capability will be available only if the following conditions are fulfilled:
|
|
Measurement |
Description |
Measurement Unit |
Interpretation |
|---|---|---|---|
|
Processes running |
Indicates the number of instances of a process(es) currently executing on a host. |
Number |
This value indicates if too many or too few processes corresponding to an application are executing on the host. Use the detailed diagnosis of this measure to find the details of the key processes. |
|
CPU utilization |
Indicates the percentage of CPU used by executing process(es) corresponding to the pattern specified. |
Percent |
A very high value could indicate that processes corresponding to the specified pattern are consuming excessive CPU resources. |
|
Memory utilization |
For one or more processes corresponding to a specified set of patterns, this value represents the ratio of the resident set size of the processes to the physical memory of the host system, expressed as a percentage. |
Percent |
A sudden increase in memory utilization for a process(es) may be indicative of memory leaks in the application. |
|
Handle count |
Indicates the number of handles that the process(es) has opened. |
Number |
A steady increase in handle count may indicate resource leaks, where the application fails to release unused handles. |
|
I/O data operations |
Indicates the number of input/output operations performed by the process(es), including both read and write operations. |
Operations/sec |
A high number may indicate heavy disk usage, which could impact system performance or indicate an I/O-intensive process. |
|
I/O data rate |
Indicates the rate at which data is read from and written to the disk by the process(es). |
KB/sec |
Spikes in this metric may point to disk bottlenecks or abnormal behavior during runtime. |
|
I/O read data rate |
Indicates the rate at which data is read from the disk by the process(es). |
KB/sec |
High read rates may be normal for database or file-heavy applications, but could also signal inefficient read operations. |
|
I/O write data rate |
Indicates the rate at which data is written to the disk by the process(es). |
KB/sec |
A high write rate may indicate frequent data logging or excessive memory dumps, which could degrade disk health over time. |
|
Number of threads |
Indicates the number of threads currently active in the process(es). |
Number |
A sudden increase might suggest inefficient thread handling or concurrency issues, potentially leading to performance degradation. |
|
Page fault rate |
Indicates the number of page faults per second encountered by the process(es) when accessing memory. |
Faults/sec |
A high rate may indicate memory pressure or insufficient physical memory, leading to slower application performance. |
|
Virtual memory used |
Indicates the amount of virtual memory used by the process(es). |
MB |
Excessive virtual memory usage may be a sign of memory leaks or poor memory management in the application. |
|
Memory working set |
Indicates the amount of memory currently in physical RAM that is used by the process(es). |
MB |
A growing working set size may indicate increasing memory demand; sustained high values might impact overall system memory availability. |
|
Private memory used |
Indicates the amount of memory used exclusively by the process(es) and not shared with others. |
MB |
A high value might indicate memory-intensive operations or memory leaks in the application. |
|
Pool paged memory used |
Indicates the amount of memory allocated from the system paged pool used by the process(es). |
MB |
A high value might reflect increased kernel-mode operations or driver activity. |
|
Pool non-paged memory used |
Indicates the amount of memory allocated from the system non-paged pool used by the process(es). |
MB |
Elevated usage may suggest kernel-mode components are consuming excessive resources, affecting system responsiveness. |
|
Committed memory used |
Indicates the amount of committed memory used by the process(es), including RAM and page file usage. |
MB |
A rising trend may indicate increasing memory consumption and can lead to resource exhaustion if not managed. |
Note:
- The default configurations of the Processes test are applicable for JRun server 4.0. However, if you are monitoring a JRun server 3.0, you would have to modify the default configurations.
- In JRun server 3.0, 2 processes are associated with the admin and default servers. They are, "jrun.exe" and "javaw.exe" respectively in Windows and "jrun" and "javaw" in Unix.
- Similarly, the JRun Server 4.0 has two default processes, one running for the admin server and the other for the default server. These processes are, namely, "jrun.exe" in Windows and "jrun" in Unix. When you add a new server instance, these processes get created automatically with the same names as mentioned above.
-
Special characters that are not allowed as part of your manual pattern specifications are as follows:
- ` (Grave Accent)
- | (Vertical bar)
- < (less than)
- > (greater than)
- ~ (tilda)
- @ (at)
- # (hash)
- % (Percent)
Note:
- Administrators can extend the built-in auto-correction capabilities to address probable issues with the other measures of the Processes test, by writing their own corrective scripts for the same. The custom-defined script can be associated with the Processes test in the same manner discussed above.
- The name of the custom-defined script should be of the following format: InternalTestName_InternalMeasureName. For example, a script that is written to correct problems with the CPU utilization measure (of the Processes test) should be named as "ProcessTest_Cpu_util”, where ProcessTest is the internal name of the Processes test, and Cpu_util is the internal name for the CPU utilization measure. To know the internal names of tests and measures, use any of the eg_lang*.ini file in the <EG_INSTALL_DIR>\manager\config directory. The script extensions will differ according to the operating system on which it will execute. The extensions supported by Windows environments are: .bat, .exe, .com, and .cmd. Scripts to be executed on Unix environments do not require any extension. The most commonly used extension is .sh.
- At any given point of time, only one script can be specified in the Corrective Script text box.
- As already stated, the sample script for Processes test will be available for every operating system. If the script is uploaded to the eG manager once for an operating system, it will automatically apply to all the agents executing on the same operating system. For example, say that an environment comprises of 3 agents, all executing on Windows 2000 environments. While configuring the Processes test for one of the agents, if the administrator uploads the sample script, then he/she will not have to repeat the process for the other 2 agents.
- Once the eG agent downloads a corrective script from the eG manager, any changes made to the script in the manager side will not be reflected in the agent side, immediately. This is because, the eG agent checks the manager for the existence of an updated version of the corrective script, only once a day. If an update is available, the agent downloads the same and overwrites the script that pre-exists.
Note:
The Processes test of LDAP servers takes an additional parameter named ispassive. If the value chosen against this parameter is Yes, then the LDAP server under consideration is a passive server in an LDAP cluster. No alerts will be generated if the server is not running. Measures will be reported as “Not applicable” by the agent if the server is not up.
Auto-configuring the Process Patterns to be Monitored
To save the time and effort involved in manual process specification, eG Enterprise offers an easy-to-use auto-configure option in the form of a  button that is available next to the Process text box.
To auto-configure the processes to be monitored, do the following:
-
Click on the
icon next to the process text box in the Processes test configuration page (see Figure 1).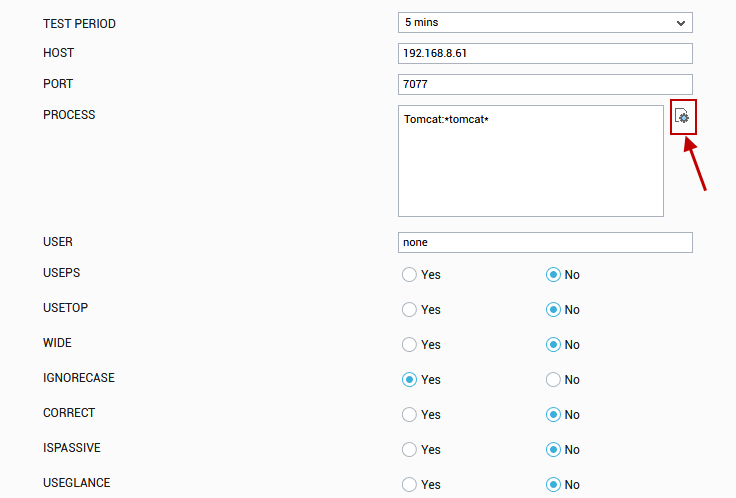
Figure 1 : Configuring the Processes test
Note:
The
icon will appear only if the following conditions are fulfilled:- The Processes test must be executed in an agent-based manner.
- The eG agent executing the test should be of version 5.2 or above.
- In case the eG manager in question is part of a redundant manager setup, then the agent executing the test must be reporting metrics to the primary manager only.
-
When the
icon is clicked, a process configuration page will appear (see Figure 2). 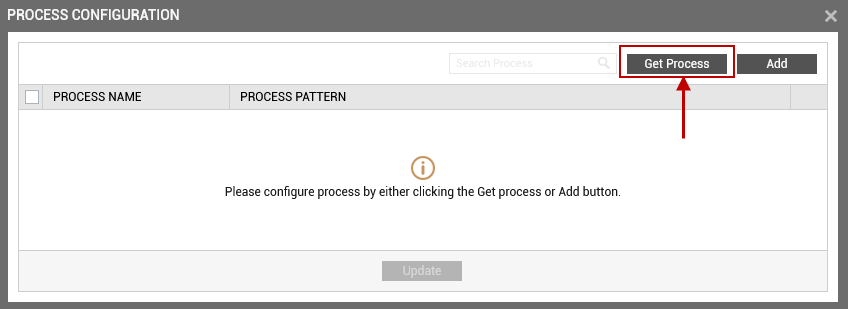
-
Upon clicking the Get Processes button in the process configuration page (see Figure 2), a pop up window with a list of processes that are running on the host will be displayed (see Figure 3).
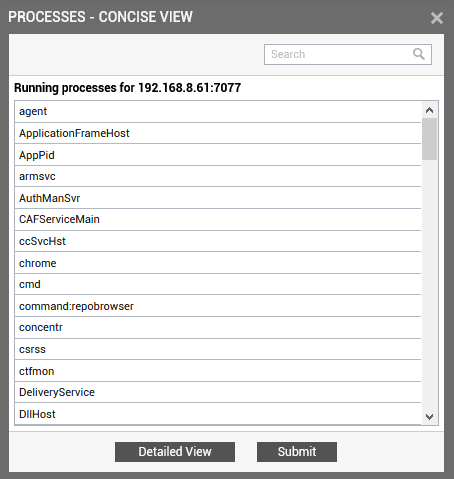
Figure 3 : List of auto-discovered processes
Note:
The processes that are already configured for monitoring will not be listed in Figure 3.
-
By default, Figure 3 provides a 'concise' view of the process list - i.e., only the process names will be listed in the pop-up window, and not the detailed description of the processes. You can click on the Detailed View button in the pop up window to switch to the detailed view (see Figure 4).
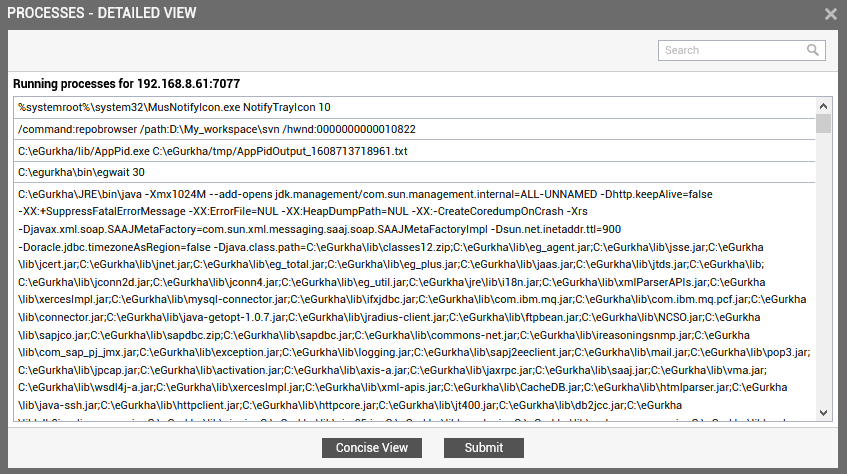
- As you can see, in the detailed view, the complete process path and process arguments accompany each auto-discovered process.
-
Regardless of the view you are in, select the process or list of processes that require monitoring and click the Submit button in the pop-up window. Note that you can select processes from both the views. If there are too many processes running in the host to choose from, you can narrow your search further by using the Search text box. Specify the whole/part of the process name to search for in this text box, and click the icon next to it.
Note:
The Processes test includes a wide flag that is set to Yes by default. In this case, your process specification can include the process path and arguments (if any). Therefore, if the wide flag is set to Yes, then, the eG agent will report metrics for the process(es) that are selected in both the concise manner and detailed manner. If the WIDE flag is set to No, the eG agent will collect metrics only for the process(es) that are selected in a concise manner.
-
Clicking the Submit button in the pop-up will automatically populate the name and pattern of the chosen process in the Process Name and Process Pattern columns available in the process configuration page (see Figure 5).
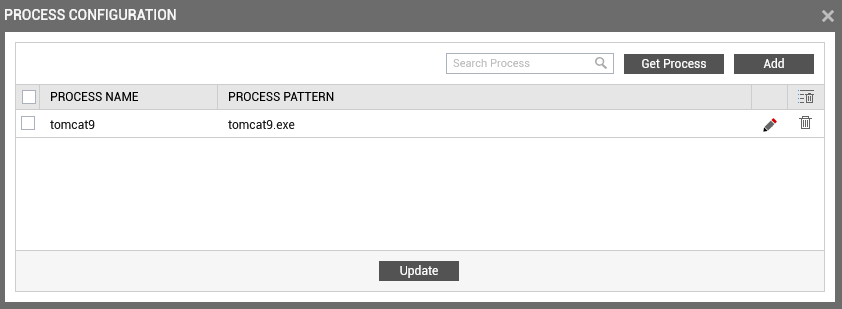
Figure 5 : One/Multiple auto-discovered processes configured for monitoring
-
You can add more name:pattern pairs in the process configuration page by clicking on the Add button present at the right corner of the page. To remove a specification that pre-exists, just click on the
 icon that corresponds to it. You can also modify contents of the Process Name and Process Pattern columns by clicking on the
  icon that corresponds to it.
 Note:
Duplicate processes will appear in the list of processes pop-up, provided the process description is different - for instance, if a 'cmd.exe' process and a 'cmd.bat' process execute on the same host, then both processes will be listed as 'cmd' in the 'concise' view of the process list. If such duplicate processes are chosen for monitoring, then, each process will appear as a separate Process Name and Process Pattern pair in the process configuration page. To proceed, the user must enter a different name for each process using the
icon, so that every distinct pattern can be identified in a unique manner. - If you want to clear all the processes that you have added for monitoring, select all the processes by simply clicking the check button provided in the header row and click on the
 icon at the right-corner of the table. This action will remove all the processes in single click. If you want to remove some of the processes, then select only those processes by checking the check buttons that correspond to them and click on the icon. This will remove the chosen processes alone.