
New SAP Alerts Test
Every SAP solution is bundled with a monitoring architecture, and alerts form a central element of this architecture. They quickly and reliably report errors – such as values exceeding or falling below a particular threshold value or that a SAP component has been inactive for a defined period of time. These alerts are displayed in the Alert Monitor - this is a central tool that facilitates efficient administration and monitoring of distributed SAP solutions.
An alert is uniquely assigned to one monitoring tree element (MTE) in the Alert Monitor. A set of monitoring tree elements (MTEs) that are arranged in a hierarchical structure becomes a Monitor. These Monitors can be grouped to form a Monitor Set.
The alerts contain a status indicator with a color and a numerical value. Yellow means a warning, red means a problem, green means normal, and the numerical value shows the severity of the reported error.
Using APIs provided by SAP, this test pulls out useful statistics related to SAP ABAP alerts from the AlertMonitor. Besides reporting the total number of alerts generated on every Monitor that is configured, the test also reveals the number of alerts in various states (red, yellow, green, etc.). You can even optionally generate detailed measures to view additional alert information such as the alert description and its severity. This way, the eG monitoring console serves as a single, central platform that displays the details of the open and completed alerts related to a monitored SAP ABAP instance.
Target of the test : A SAP ABAP instance
Agent deploying the test : An internal/remote agent
Outputs of the test : One set of results for every configured Monitor.
| Parameter | Description |
|
Test Period |
How often should the test be executed |
|
Host |
Host name of the server for which the test is to be configured. |
|
PortNo |
Enter the port to which the specified host listens. |
|
ClientName |
Specify the ID of the client system as what the eG agent will be connecting to the SAP ABAP instance. To know how to determine the client ID to use, follow the instructions provided in Determining the Client ID/Name for the eG Agent to Connect to the SAP ABAP Instance. |
|
SAPUser |
Typically, to connect to a SAP ABAP instance and run tests, the eG agent requires the permissions of a SAP user who has been assigned |
|
Password |
The password of the specified SAPUser. |
|
Confirm Password |
Confirm the password by retyping it here. |
|
SysNo |
This parameter appears only if the Use SAPControl flag is set to No – i.e., if the test uses SAPJCO to collect measures. An indicator of the TCP/IP port at which the SAP server listens. For example, for a server that listens at port 3200, the SysNo will be ‘00’. Similarly, if the SAP server port is 3201, the SysNo will have to be specified as ‘01’. Therefore, in the SysNo text box specify the system number of the SAP server with which the specified client communicates. To know the system number for the ABAP server being monitored, follow the procedure detailed in Identifying the SAP Router String and System Number. |
|
Router |
This parameter appears only if the Use SAPControl flag is set to No – i.e., if the test uses SAPJCO to collect measures. If the SAP client with the specified ClientName exists in a network external to the SAP server, then a router will be used to enable the server-client communication. In such a case, specify the router string of the router in the Router text box. If both the client and the server exist in the same network, then specify ‘none’ against the Router text box. To know what is the SAP Router string for the ABAP server being monitored, follow the procedure detailed in Identifying the SAP Router String and System Number. |
|
InstanceName |
This parameter appears only if the Use SAPControl flag is set to No – i.e., if the test uses SAPJCO to collect measures. This is set to none by default. This implies that the eG agent automatically discovers the instance name at run time. |
|
Timeout |
Indicate the duration (in seconds) for which this test should wait for a response from the SAP ABAP instance. By default, this is set to 120 seconds. |
|
JCO Version |
The eG agent uses the SAP JCO library to connect to the SAP ABAP system and pull out metrics. To enable the eG agent to make this connection and query the metrics, you need to specify the version of the SAP JCO library that the agent needs to use. For instance, to instruct the eG agent to use JCO v2.1.19, it would suffice if you specify the ‘major version number’ alone against JCO Version – in the case of this example, this will be 2.x. Note that if you have downloaded the SAP JCO CONNECTOR files for SAP JCO version 3 from the SAP market place (as instructed by Downloading the SAP JCO Connector files Required for Monitoring ), then the JCO Version configuration should be 3.x. |
|
Sets |
Provide a comma-separated list of monitor sets for which performance attributes are to be monitored. For example: SAP CCMS Monitor Templates,Monitor Collection for Certification |
|
Monitors |
Provide a comma-separated list of monitors under the configured monitor Sets for which performance attributes are to be monitored. While specifying the list of Monitors, make sure that you specify them in the same order as that of your monitor sets specification. For instance, the first monitor in your Monitors list should belong to the first monitor set in your Sets specification, and so on. This implies that if your Sets specification reads as follows - SAP CCMS Monitor Templates,Monitor Collection for Certification- then the first monitor in your Monitors specification should belong to the SAP CCMS Monitor Templates set and the second monitor should belong to the Monitor Collection for Certification set. In this case, your Monitors specification may read as follows: Dialog Overview,Test Monitor Syslog. If you want to include more than one monitor from a particular monitor set in your Monitors specification, then make sure that you repeat that monitor set’s name as many times in your sets specification. While configuring the Sets and Monitors, you may want to know the exact names of the monitors and monitor sets that form part of your specification. To determine this, follow the procedure discussed in Page While configuring the monitor details, you may want to know the exact names of the monitors and monitor sets that form part of your specification. To determine this, do the following: . |
|
XMI Audit Level |
The XMI interface is a general framework for the CCMS external system management interfaces. This interface contains essential function modules and structures that coordinate connections between external system management tools and individual CCMS interfaces, and writes messages in the SAP ABAP XMI log on behalf of the external tool. The XMI log is a table containing English message texts. The messages can have various degrees of detail. The audit level determines the degree of detail to which messages in the XMI log are written - i.e., whether the message should always be logged, or is simply a message which supplies further detail (higher detail degree). The XMI log contains messages from external tools and also messages which arise in SMAPI functions. To indicate to the test the degree of detail to which messages from the eG agent are to be written in the XMI log, you need to specify the XMI Audit Level. By default, this parameter is set to 0, which indicates that all calls that modify the database are to be logged. The other values this parameter can take and their implications are discussed below:
|
|
Detailed Diagnosis |
To make diagnosis more efficient and accurate, the eG Enterprise embeds an optional detailed diagnostic capability. With this capability, the eG agents can be configured to run detailed, more elaborate tests as and when specific problems are detected. To enable the detailed diagnosis capability of this test for a particular server, choose the On option. To disable the capability, click on the Off option. The option to selectively enable/disable the detailed diagnosis capability will be available only if the following conditions are fulfilled:
|
| Measurement | Description | Measurement Unit | Interpretation |
|---|---|---|---|
|
Total number of alerts |
Indicates the total number of alerts that have occurred for this monitor since the last measurement period. |
Number |
The detailed diagnosis of this measure, if enabled, provides the complete details of all the alerts associated with the corresponding monitor. The details include: Date, Time, System, Context, Object Name, Short Name, Status, Importance and Alert Text. Alternatively, you can navigate to the Components -> SAP -> Alerts to selectively view the alerts related to specific monitor sets or monitors, alerts of a specific status, or alerts generated during a given period. |
|
Number of red alerts |
Indicates the number of errors or critical status messages that have occurred for this monitor since the last measurement period. |
Number |
To view the alerts and rectify them instantly, you can navigate to the Components -> SAP -> Alerts page in the eG monitoring console. |
|
Number of yellow alerts |
Indicates the number of warning alerts that have occurred for this monitor since the last measurement period. |
Number |
To view the alerts and rectify them instantly, you can navigate to the Components -> SAP -> Alerts page in the eG monitoring console. |
|
Number of green alerts |
Indicates the number of events or components that were running normally since the last measurement period. |
Number |
It is also possible to generate messages for green “alerts” and react to them correspondingly. Green alerts of this type do not indicate error situations, but are intended as all-clears or explicit messages that an action was successful. You can activate green alerts in the Alert Monitor for performance attributes and status attributes. Behavior in the case of performance attributes is as follows:
|
|
Number of active alerts |
Indicates the number of alerts that are active since the last measurement period. |
Number |
An abnormally high value could indicate that the SAP ABAP component is problem-prone. You may want to navigate to the Components -> SAP -> Alerts page in the eG monitoring console to take a closer look at the active alerts, and decide on a course of action. |
|
Number of completed alerts |
Indicates the number of alerts that were rectified manually since the last measurement period. |
Number |
To zoom into the completed alerts, you can navigate to the Components -> SAP -> Alerts page in the eG monitoring console. |
|
Number of autocompleted alerts |
Indicates the number of alerts that were rectified automatically by this SAP ABAP system since the last measurement period. |
Number |
To zoom into the auto-completed alerts, you can navigate to the Components -> SAP -> Alerts page in the eG monitoring console. |
The detailed diagnosis of the Total number of alerts measure provides the complete details of the alerts generated on a configured monitor. The details include: Date, Time, System, Context, Object Name, Short Name, Status, Importance and Alert Text.
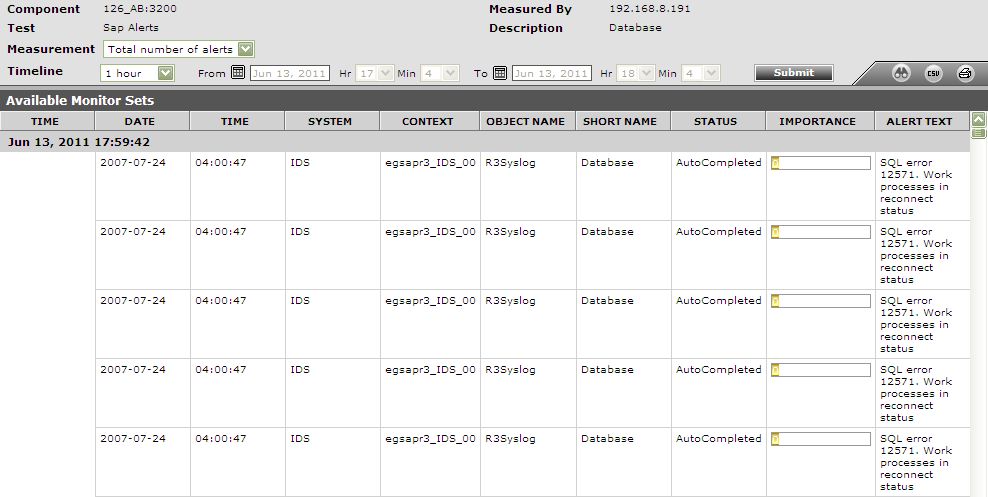
Figure 1 : The detailed diagnosis of the Total number of alerts measure
