Sybase Job Statistics Test
In any database environment, scheduled jobs are essential for maintaining server health and ensuring smooth operations. These jobs handle tasks such as backups, data imports, index maintenance, and other automated processes critical to system performance. However, despite their importance, these jobs can face potential issues, including the accumulation of unexecuted jobs due to scheduling conflicts or resource constraints, jobs running longer than expected, which may indicate inefficiencies or poorly tuned queries, high concurrency leading to resource contention, and incomplete or delayed maintenance tasks that can affect overall system performance.
Monitoring job statistics allows administrators to detect abnormal patterns, such as sudden spikes in total jobs, high concurrency, or unusually long job durations. It provides detailed insights into job ID, state, start time, duration, user request, and server, enabling proactive management and optimization of scheduled tasks. The Sybase Job Statistics Test collects key job metrics, including the total number of jobs on the server, the number of jobs actively running, and the maximum execution time among currently running jobs. By analyzing these metrics, administrators can detect workload build-up or scheduling conflicts early, identify jobs consuming excessive resources, optimize job scheduling and resource allocation, and ensure that critical maintenance tasks are executed reliably and within acceptable time limits.
Target of the test : A Sybase ASE server on which the MDA tables is installed.
Agent deploying the test : An internal/remote agent
Outputs of the test : One set of results for every Sybase Database server being monitored.
| Parameter | Description |
|---|---|
|
Test Period |
How often should the test be executed. |
|
Host |
Refers to the IP address of the Sybase ASE server. |
|
Port |
The port number at which the Sybase server listens to. |
|
User |
To enable this test to connect to the Sybase server and collect the required metrics, it is enough if you configure the test with the name of a Sybase user who has the “mon_role”. However, for best results, it is recommended that you configure all Sybase tests with the credentials of a Sybase user who has the “mon_role”, “sa_role’, and “sybase_ts_role”. To collect job statistics-related measures, the user must also be granted the js_admin_role. For the steps to grant this permission, refer to Prerequisites for Monitoring Sybase Job Statistics. |
|
Password |
The password corresponding to the above user. |
|
Confirm Password |
Confirm the password by retyping it here. |
|
Elapsed Time |
In this text box, specify the duration (in seconds) for which a query should have executed for it to be regarded as a long running query. The default value is 5. |
|
DDRowCount |
Specify the number of long running queries for which details will be available in the detailed diagnosis page. By default, this parameter is set to 5. This indicates that even if the total number of long running queries is, say 10, the detailed diagnosis of this test will provide information pertaining to only 5 queries by default. For information related to more number of queries, you should increase the DDRowCount. |
|
Detailed Diagnosis |
To make diagnosis more efficient and accurate, the eG Enterprise embeds an optional detailed diagnostic capability. With this capability, the eG agents can be configured to run detailed, more elaborate tests as and when specific problems are detected. To enable the detailed diagnosis capability of this test for a particular server, choose the On option. To disable the capability, click on the Off option. The option to selectively enable/disable the detailed diagnosis capability will be available only if the following conditions are fulfilled:
|
| Measurement | Description | Measurement Unit | Interpretation |
|---|---|---|---|
|
Total jobs |
Indicates the total number of jobs in the server. |
Number |
These jobs can include scheduled administrative and maintenance tasks such as backups, data imports, index maintenance, and other automated tasks managed by the ASE Job Scheduler. A sudden increase may indicate workload growth or accumulation of jobs not being executed on time. |
|
Current jobs |
Indicates the number of jobs currently running. |
Number |
This measure represents background tasks actively being executed by the job scheduler. Monitoring helps identify job concurrency levels and potential resource contention. A consistently high number may suggest overlapping schedules or jobs taking longer than expected. The detailed diagnosis provides additional insights like Job ID, state, start time, duration, user request, server, job name, and message. |
|
Maximum duration of current jobs |
Indicates the maximum duration that any currently running job has been executing. |
Seconds |
This measure helps identify jobs that are taking unusually long to complete. Helps assess whether scheduled tasks are running within acceptable time limits. Very high durations may indicate inefficient queries, blocking, resource contention, or poorly tuned jobs. The detailed diagnosis helps pinpoint which job is consuming excessive execution time by reporting metrics such as Job ID, state, start time, duration, user request, and message. |
Prerequisites for Monitoring Sybase Job Statistics
Before monitoring Sybase job statistics, the monitoring user must have sufficient privileges to execute the stored procedure sp_sjobhelp. By default, newly created users in Sybase may not have the required permissions, which can lead to errors when attempting to query job-related information. The following steps outline how to configure a user with the appropriate role and validate access.
-
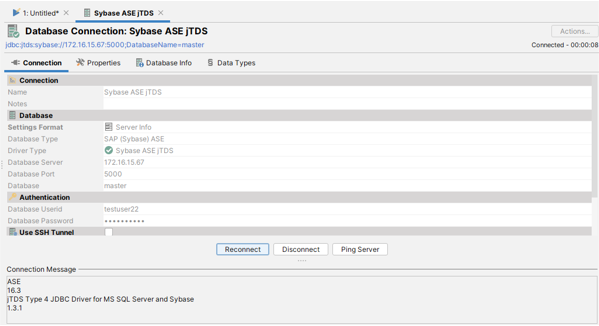
Create a monitoring user (for example, testuser22) and log in to the target database using this account as given in Figure 1.
Execute the following command:
sp_sjobhelp @option='list_all_users,running'
The execution will fail with an EXECUTE permission denied error since the newly created user does not have the required privileges (see Figure 2).
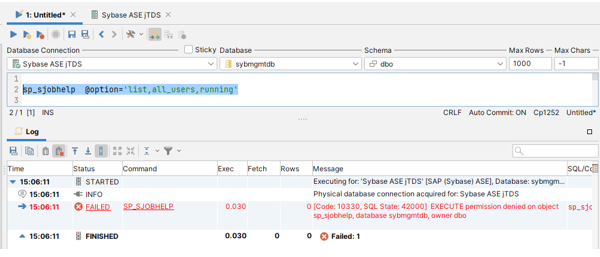
Figure 2 : Execution failed due to insufficient user privileges.
-
Now, log in to the database using the SA (System Administrator) user.
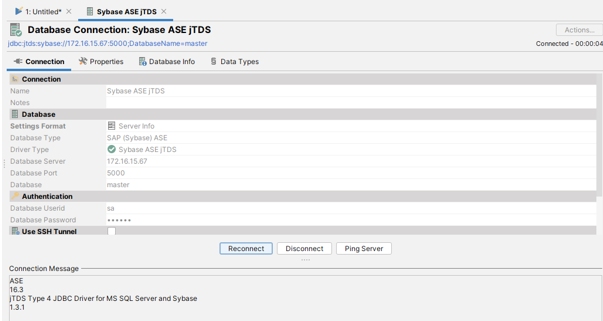
Figure 3 : Login as admin user
-
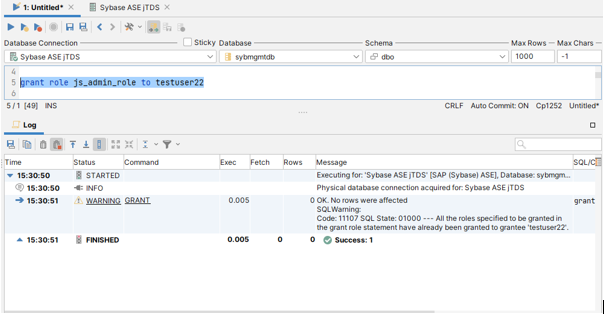
Grant the required role to the monitoring user by running the below command:
use sydbgmtdb
grant role js_admin_role to testuser22
This assigns the js_admin_role, which is necessary to run job management procedures, refer to Figure 4.
-
Next, log out from the SA account and log back in as testuser22. Re-run the command :
sp_sjobhelp @option='list_all_users,running'
This time, the stored procedure should execute successfully, and the expected job statistics will be retrieved without permission errors.
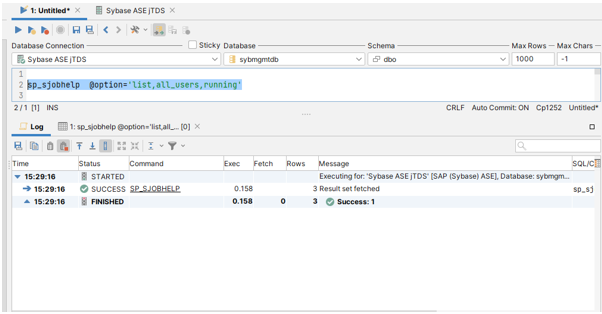
Figure 5 : Successfullly executed