The VM Dashboard
In large virtualized infrastructures today, a number of business-critical applications are being deployed on tens of virtual machines configured on a variety of virtualization platforms (e.g., VMware ESX, Citrix XenServer, Solaris LDoms, etc.), so as to optimize space and resource usage. In such environments, excessive resource usage by a single VM or a resource pool on a virtual host can cause a huge dent in the resources available to other VMs, thereby affecting the performance of the applications executing on those VMs! To ensure a high uptime for their key applications, administrators need to track in real-time the resource usage across VMs and physical servers regardless of the underlying virtualization platform, quickly detect abnormal usage patterns, accurately identify the VM(s) responsible for the same, and promptly initiate corrective action. Likewise, in environments where centralized management tools such as VMware vCenter are used, administrators also need to keep tabs on the availability and overall health of these tools, so as to ensure that performance degradations that the tool experiences does not impact the performance of the ESX servers it manages.
eG Enterprise provides a single, central VM Dashboard that provides an integrated interface from where administrators can compare resource usage across physical servers and VMs on each physical server, and provides them with real-time insights into the health of the physical servers, the status of the VMs, and how each VM currently uses the allocated and physical resources available to it.
Using this dashboard, administrators can:
- Understand, from a single look, the composition of the managed virtualized environment - in other words, using the dashboard, you can easily view and instantly figure out the complete hierarchical structure of your virtualized environment; for instance, for a VMware environment, the dashboard will help you identify the number of vCenter servers that are being managed, the number of datacenters configured on each vCenter, the clusters (if any) that exist within the datacenters, the ESX servers being managed by every datacenter, the resource pools on each ESX server, and the VMs that each resource pool comprises of.
- Detect at a glance, excessive resource usage by any VM, cluster, resource pool, or a physical server from across the environment, regardless of the virtualization technology in use; quickly diagnose the root-cause of the resource drain with the help of efficient drill down features;
- Accurately identify resource-intensive VMs/resource pools/clusters/physical servers;
- Promptly detect unavailable datastores;
- Instantly spot a powered-off VM anywhere in the environment;
- Know which VM is currently operating on which physical server, and thus keep tabs on VMotion/XenMotion (as the case may be) activities;
- View a consolidated list of issues currently encountered by physical servers and virtual machines across the environment and also per virtual component, so as to ease the troubleshooting efforts of a dedicated help-desk;
- Quickly identify and troubleshoot issues with vCenter servers (if any) in the environment;
To access the VM Dashboard, follow the menu sequence: Dashboards -> Virtualization -> Hosts and Clusters in the eG monitoring console. Figure 1 then appears:
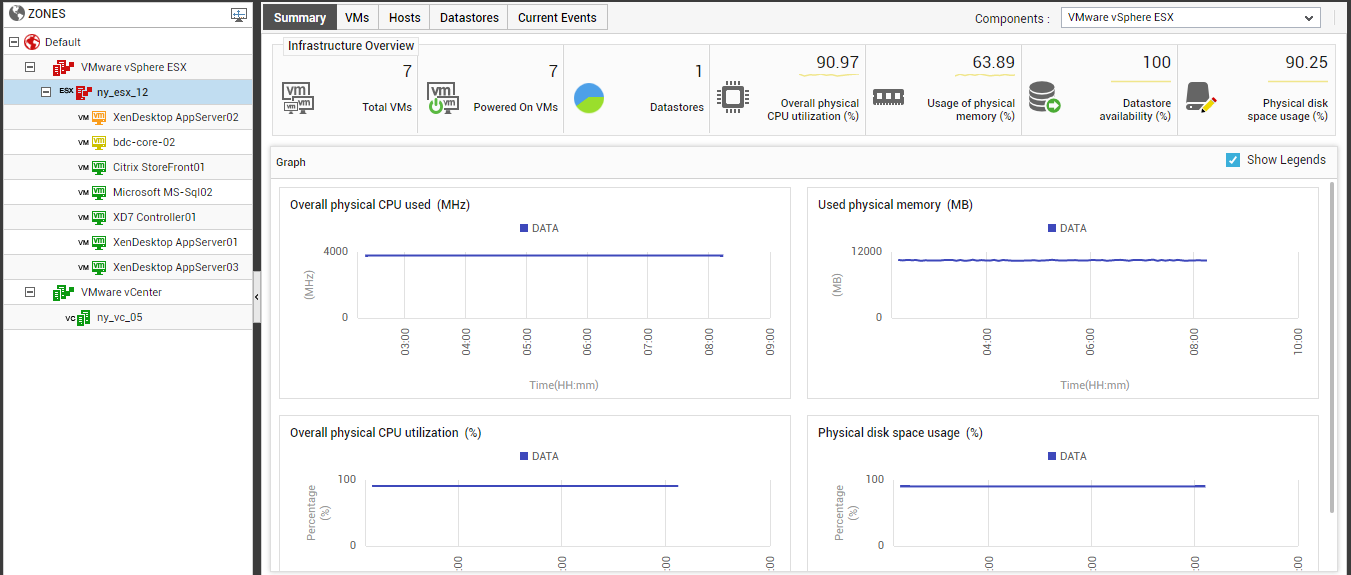
The VM Dashboard of Figure 1 comprises of two panels. The left panel boasts of a tree-structure, comprising of a default global node named Zones. All the zones/farms in the target environment that have been configured with one/more virtual hosts (eg., VMware ESX servers, Citrix XenServers, etc.) or VMware vCenter servers, will be the sub-nodes of the Zones node. If you expand a particular zone node in the tree, you will find that the virtual component-types that have been added to that zone appear as its sub-nodes (see Figure 2). If you expand any node under the zone node that corresponds to a particular virtual server-type (eg., VMware vSphere ESX, VMware vSphere VDI, Citrix XenServer, etc.), then such a tree will typically comprise of virtual hosts of that type that are included in the zone. Expanding the virtual host node will reveal the VMs executing on that host and resource pools (if any) configured on that host (see Figure 2).
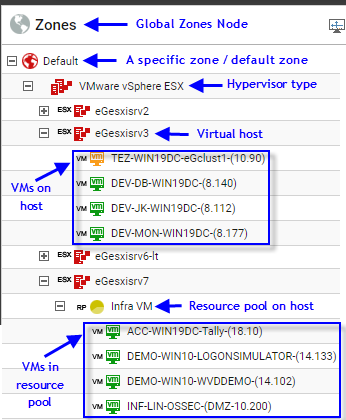
Figure 2 : The virtual host node and its sub-nodes
In addition to sub-nodes representing a virtual server-type, if a VMware vCenter component has been added to the zone, then a VMware vCenter sub-node will also appear under the corresponding zone node. If you expand the node representing the VMware vCenter component-type under a zone, then all the managed vCenter servers will appear as its sub-nodes (see Figure 3). Expanding a particular vCenter server node will reveal the folders (if any) configured on that vCenter server (you will not find any folder representations in Figure 3); similarly, expanding a particular folder node will reveal the datacenters (if any) that are being managed by that vCenter server. To view the virtual hosts/clusters configured within a datacenter, you will have to expand the corresponding datacenter node. While the cluster tree (not shown in Figure 3) will contain virtual hosts within the cluster as its sub-nodes, expanding a virtual host tree will reveal the VMs and resource pools that are executing on that virtual host. You can also view the virtual host tree by expanding any node that corresponds to a virtual host type under a particular zone node. The state of a node in the tree depends upon the current state of its sub-nodes. Independent virtual hosts/vCenter servers that are not part of any existing zone will be automatically grouped under the Default zone tree (see Figure 3)
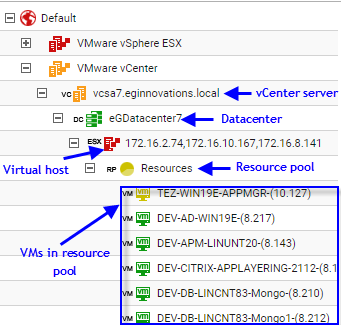
Figure 3 : The VMware vCenter node and its sub-nodes
Note:
While the vCenter server tree will list even those ESX servers that are not monitored by eG Enterprise, the tree will not indicate the current state of such servers; also, clicking on any such server will not display corresponding performance information in the tab pages in the right panel.
By default, the tree-structure lists all virtual hosts, clusters, and virtual machines. Accordingly, when you click on the  button at the right, top corner of the left panel, both the Hosts And Clusters and Show Virtual Machines options will be chosen by default from the Display Settings section (see Figure 4 ) that appear. To view only the VMs in the tree, select the Show Virtual Machines check box, but deselect the Hosts And Clusters check box. To hide VMs from the tree-view, select the Hosts And Clusters check box, but leave the Show Virtual Machines check box deselected.
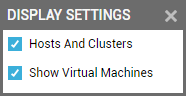
Figure 4 : Display settings for the tree-view
The right panel (see Figure 1) is a context-sensitive panel, the contents of which will vary according to the node chosen from the left panel. By default, this panel provides 4 tab pages - a Summary tab page that provides a quick summary of performance and problem information pertaining to the node chosen from the tree, a VMs tab page that provides current status updates related to virtual machines, a Hosts tab page that displays virtual host-specific metrics gathered in real-time, and a Current Events tab page that lists the problems currently experienced by virtual hosts and guests. By default, all the tab pages provide information pertaining to managed VMware vSphere ESX servers in the environment. Accordingly, the VMware vSphere ESX option is chosen from the drop-down list in the top, right corner of the right panel (indicated by Figure 1). You can view details for a different virtual component type, by selecting a different option from this drop-down list.
Note:
As stated earlier, by default, the tab pages in the right panel provide details related to VMware vSphere ESX servers. This default setting can be overridden in the following manner:
-
Click on the
 button at the right, top corner of the right panel.Figure 5 then appears.
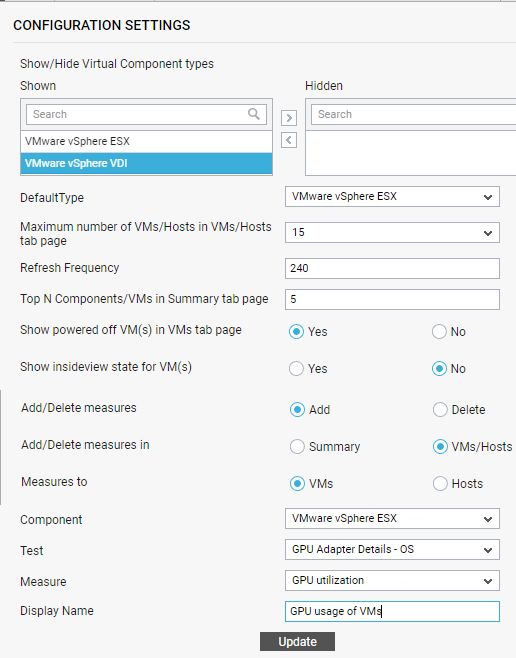
-
By default, the VMware vSphere ESX option is chosen from the DefaultType list in Figure 5, indicating that the details in the right panel pertain to the managed VMware vSphere ESX components by default. To change the default setting, you will have to select a different option from this list.
-
Then, click the Update button in Figure 5.
Similarly, every tab page, by default, displays the details of the top 15 VMs/virtual hosts only. This is indicated by the default value 15 chosen from the Limit to list at the right, top corner of each tab page. To view more (or less) number of records in the tab pages, you will have to select a different value from the Limit to list. Alternatively, you can even override the default value 15, so that the tab pages display more or a less number of records by default. To achieve this, click the  button in the right panel, and set the Maximum number of VMs/Hosts in VMs/Hosts tab page parameter in Figure 5 that appears next to any value other than 10.
The