Service Status Test
Zoom offers a number of services to the customers like Zoom meetings, Zoom phone, Devices, recording services, BYOC etc. for seamless experience for the end users, all of these services should be available. These services do get interrupted though sometimes because of issues on Zoom cloud, and other times due to scheduled maintenance activities. It is important for the administrators to know about the scheduled maintenance so that they can inform users and plan accordingly. On the other hand if this is unplanned issue, it helps administrators to know so that they don't waste time investigating their own infrastructure. Zoom provides service status page (http://status.zoom.us), where the current status of each service is updated and information about any planned maintenance activities is also published. That is precisely the reason it is important for monitoring software to keep an eye on this page to report latest service status to administrators.
This test monitors the service status page and reports key metrics like status and scheduled maintenance window. The detailed diagnosis of the measures reveal further details of scheduled maintenance like start time, end time etc.
Target of the test : Zoom
Agent deploying the test : A remote agent
Outputs of the test : One set of results for each combination of Zoom Product: service executing on the target Zoom platform that is being monitored
| Parameters | Description |
|---|---|
|
Test period |
How often should the test be executed, the default value is 30 mins. |
|
Host |
The host for which the test is to be configured. By default, this is zoom.us |
|
Status URL |
Zoom provides status of cloud services on Zoom service status page. By default the page service URL is http://status.zoom.us. Specify URL of Zoom API here. |
|
DD Frequency |
Refers to the frequency with which detailed diagnosis measures are to be generated for this test. The default is 1:1. This indicates that, by default, detailed measures will be generated every time the test runs, and also every time the test detects a problem. You can modify this frequency, if you so desire. Also, if you intend to disable the detailed diagnosis capability for this test, you can do so by specifying none against DD Frequency. |
|
Detailed Diagnosis |
To make diagnosis more efficient and accurate, the eG Enterprise embeds an optional detailed diagnostic capability. With this capability, the eG agents can be configured to run detailed, more elaborate tests as and when specific problems are detected. To enable the detailed diagnosis capability of this test for a particular server, choose the On option. To disable the capability, click on the Off option. The option to selectively enabled/disable the detailed diagnosis capability will be available only if the following conditions are fulfilled:
|
| Measurement | Description | Measurement Unit | Interpretation | ||||||||||||
|---|---|---|---|---|---|---|---|---|---|---|---|---|---|---|---|
|
Status |
Indicates the current status of this service. |
|
The values reported by this measure and its numeric equivalents are mentioned in the table below:
Note: By default, this measure reports the Measure Values listed in the table above to indicate whether/not service is stable. The CRITICAL state indicates that the service is unavailable. The MAJOR state indicates that the response time of the service is above the MAJOR threshold but not above the CRITICAL threshold. The MINOR state indicates that the response time of the service is above the MINOR threshold but not above the MAJOR threshold. The NORMAL state indicates that the service is responding normally. |
||||||||||||
|
Scheduled maintenance |
Indicates the total number of maintenance events that are currently scheduled. |
Number |
This measure is reported only for the Summary descriptor. The detailed diagnosis of this measure reveals the name of each maintenance event, the start time, end time and a message that briefs about the maintenance event. |
||||||||||||
|
Resolved Incidents |
Indicates the total number of incidents that were resolved. |
Number |
This measure is reported only for the Summary descriptor. The detailed diagnosis of this measure reveals the name of each incident that was resolved, the date on which the incident was resolved and a message that briefs about the resolved incident. |
||||||||||||
|
Active Incidents |
Indicates the number of incidents that are currently active. |
Number |
This measure is reported only for the Summary descriptor. The detailed diagnosis of this measure reveals the name of each incident that is currently active and a message that briefs about the incident. |
The detailed diagnosis of the Scheduled maintenance measure reveals the name of each maintenance event, the start time, end time and a message that briefs about the maintenance event.
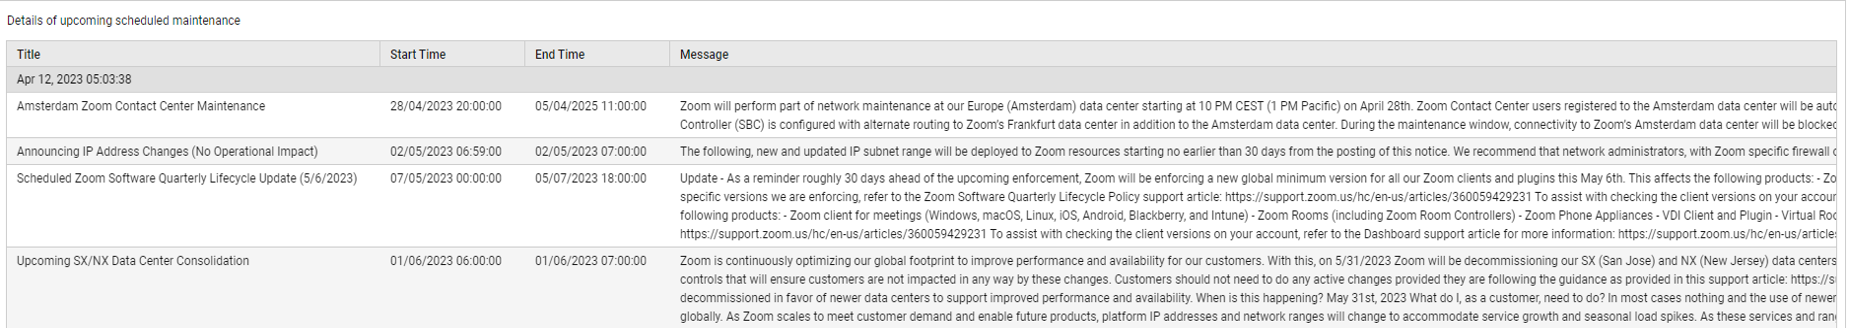
Figure 1 : The detailed diagnosis of the Scheduled maintenance measure
The detailed diagnosis of the Resolved Incidents measure reveals the name of each incident that was resolved, the date on which the incident was resolved and a message that briefs about the resolved incident.
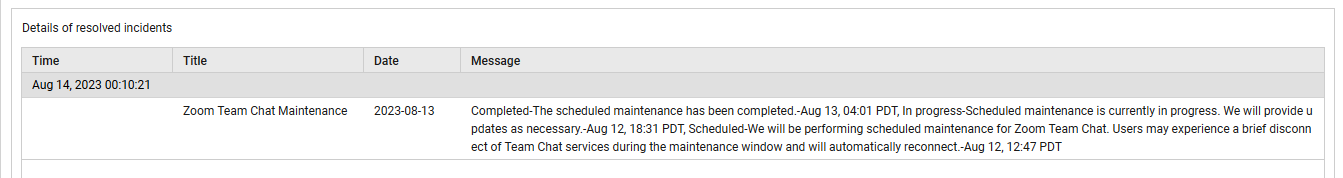
Figure 2 : The detailed diagnosis of the Resolved Incidents measure
The detailed diagnosis of the Active Incidents measure reveals the name of each incident that is currently active and a message that briefs about the incident.
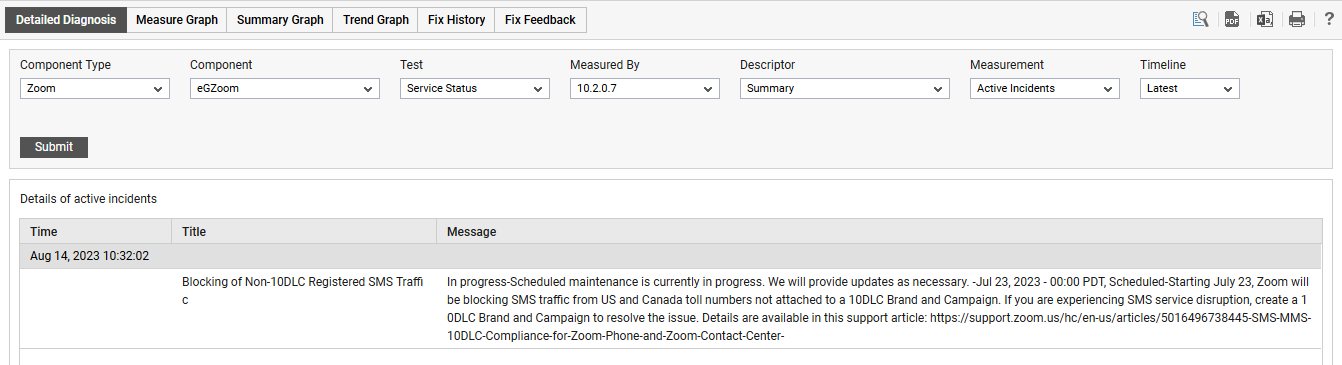
Figure 3 : The detailed diagnosis of the Resolved Incidents measure