
Server monitoring is still one of the most important disciplines in IT operations because servers remain central to application performance. That is why server monitoring tools remain essential for maintaining infrastructure health, ensuring application availability, and delivering consistent user experiences across modern IT environments. Even in cloud-heavy environments, enterprises still depend on servers across on-premises infrastructure, virtualized estates, public cloud platforms, and hybrid deployments. The best server monitoring tools for 2026 are the ones that give teams unified visibility across these layers while helping them troubleshoot faster and plan capacity with confidence.
That is also why generic infrastructure visibility is no longer enough. Modern monitoring tools must correlate server performance with service impact, detect abnormal behavior early, support heterogeneous operating systems, and provide historical analytics for optimization. With eG Enterprise, teams can monitor CPU, memory, disk, network, services, hardware, and operating system health, while also correlating application performance with server performance in a single web-based console.
What is Server Monitoring?

Server monitoring tools continuously track server availability, health, resource usage, service status, and performance metrics across physical, virtual, and cloud environments. Effective server performance monitoring helps IT teams detect faults, identify performance bottlenecks, analyze trends, and prevent outages before they impact users or business services.
In practice, server monitoring now spans much more than CPU and memory graphs. It includes process health, disk behavior, hardware conditions, application dependencies, event logs, network performance, capacity trends, and the relationship between infrastructure symptoms and business-facing application outcomes.
Why Server Monitoring Matters
Server performance problems often become application performance problems. A bottleneck in CPU, memory, disk, or network can slow down a web server, database, business application, or digital workspace environment, which in turn affects end users and business transactions.
This is why server monitoring matters in 2026 just as much as it did in previous generations of IT. If anything, it matters more now because distributed environments are harder to troubleshoot manually. Unified monitoring helps teams understand whether a service problem is being driven by the operating system, hardware, a network dependency, or an application running on top of the server.
Types of Server Monitoring Tools
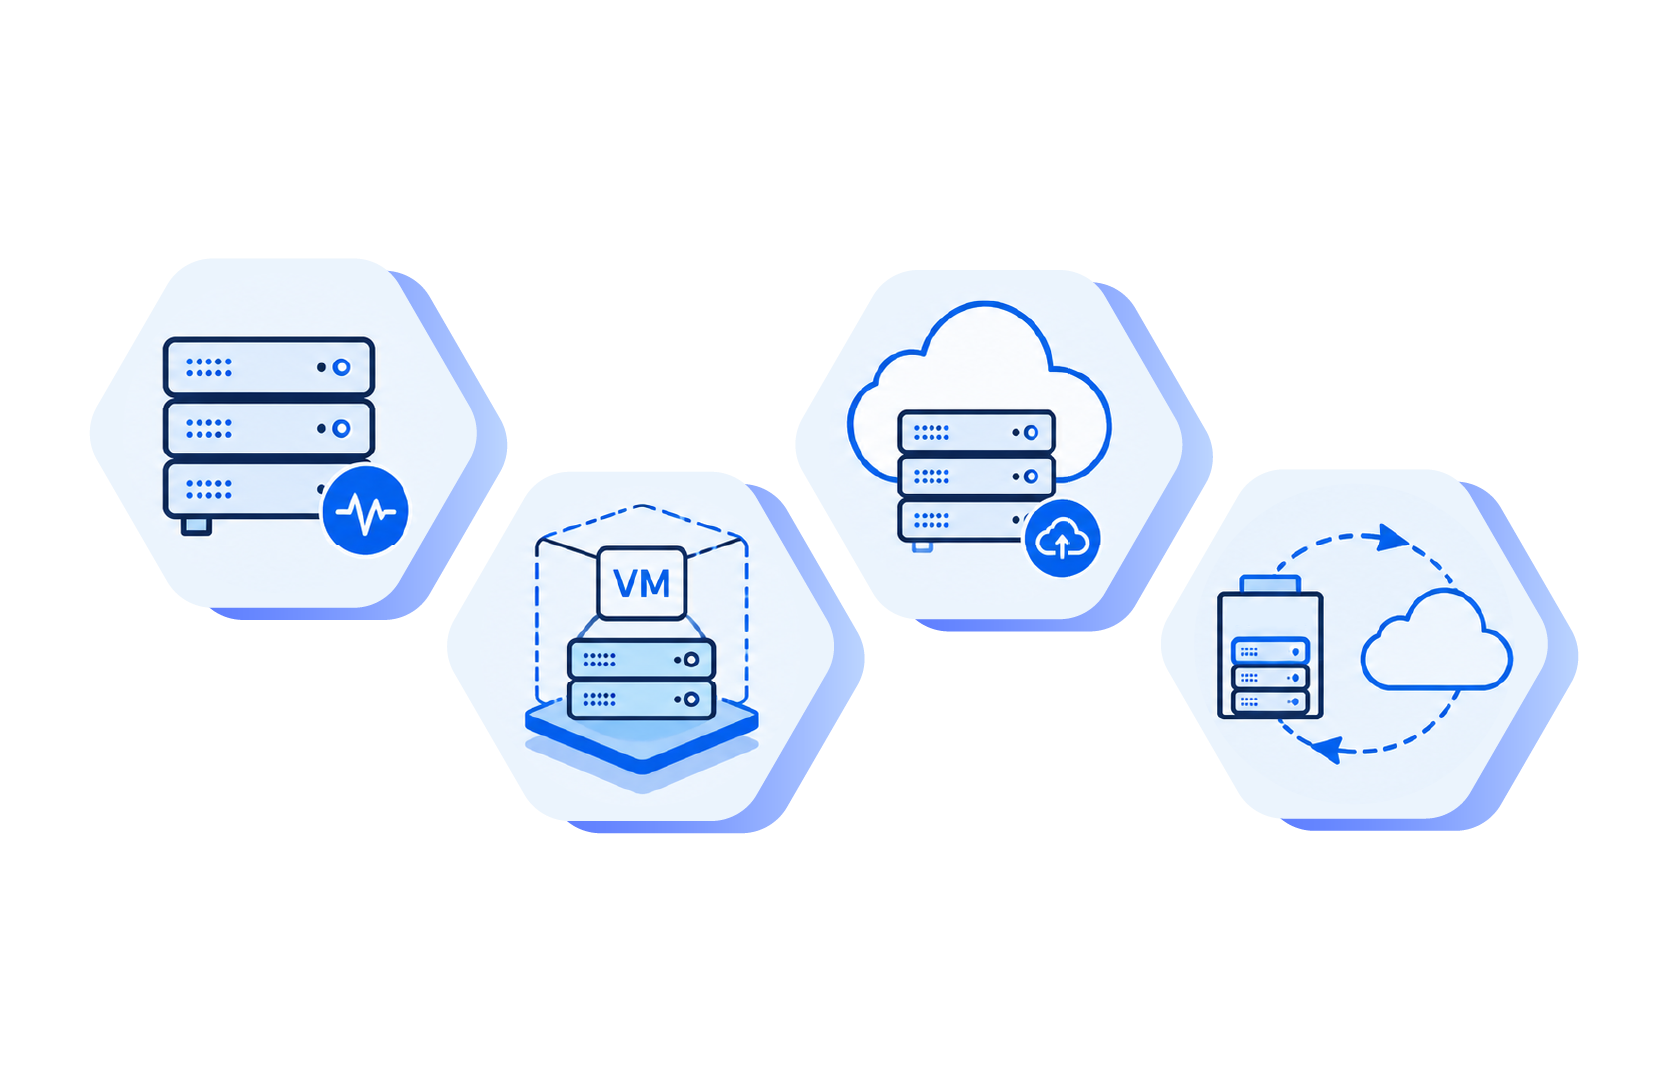
Enterprises today rarely operate one kind of server environment. The strongest platforms therefore support physical, virtual, cloud, and hybrid infrastructure from a consistent operational model.
Physical Servers
Physical server monitoring focuses on hardware health, resource availability, environmental conditions, and system reliability. Hardware faults can have an outsized impact because they may bring down multiple critical services at once.
eG Enterprise supports hardware monitoring across major vendors and operating systems, with visibility into indicators such as CPU, temperature, RAM, and power supply. This matters for enterprises that still run business-critical workloads on dedicated hardware and need early warning of failing components.
Virtual Servers
Virtual server monitoring adds another layer of complexity because performance may be influenced by the host, the hypervisor environment, or neighboring workloads. A VM can suffer from contention even when nothing appears wrong inside the guest OS.
That is why virtual server monitoring tools need to combine guest-level metrics with enough surrounding context to identify whether the problem is local or environmental. This becomes especially important in dense enterprise virtualization estates where resource competition can create intermittent performance symptoms.
Cloud Servers
Cloud server monitoring must include both the operating system and the cloud platform context. Teams need to understand both how a VM is performing and how cloud-side resource behavior, dependencies, and service configurations influence workload stability.
For Azure environments, eG Enterprise provides visibility into performance and resource utilization metrics for Azure VMs and broader cloud components. This is important because cloud monitoring without workload context can still leave teams guessing about actual service impact.
Hybrid Infrastructure
Hybrid infrastructure is now standard in many enterprises, which means server monitoring tools must bridge on-premises, private cloud, and public cloud workloads cleanly. Tool fragmentation creates operational blind spots and slows down incident response.
eG Enterprise provides unified monitoring across heterogeneous server farms, with a single pane of glass and a common layered representation for different operating systems and environments. That kind of consistency matters when teams have to manage Windows, Linux, UNIX, and cloud-hosted servers together.
Key Server Performance Metrics
The most important server metrics are the ones that help teams answer three questions quickly: Is the server healthy, is the workload stable, and is there enough capacity headroom to maintain performance?
CPU
CPU utilization is a foundational metric because sustained saturation can delay application processing, degrade response time, and create broad instability. CPU analysis should also consider whether a particular process, thread, or application is driving the spike.
For modern enterprises, CPU monitoring is not just about crossing a threshold. It is about understanding whether high usage is normal for the workload, whether it is recurring, and whether it is correlated with application slowdown or user complaints.
Memory
Memory usage helps teams identify pressure from growing demand, application leaks, or poor workload placement. Memory exhaustion can cause paging, unstable response times, and even service failures under load.
When memory trends are reviewed historically, they also become a strong capacity planning input. Slow growth over weeks or months is often a sign that right-sizing or remediation should happen before performance visibly worsens.
Disk
Disk monitoring should include both capacity and performance. Full disks can break applications and services, while poor disk I/O behavior can create long response times even when CPU and memory appear normal.
Disk metrics are especially important for databases, logging-heavy services, profile-intensive environments, and workloads with bursty transaction behavior. A server monitoring tool should surface these bottlenecks clearly enough that teams can distinguish disk pressure from other infrastructure symptoms.
Network
Network metrics help detect connectivity problems, throughput degradation, latency, and traffic abnormalities that affect access to server-hosted services. Network issues can make a healthy server appear slow, unreachable, or unstable.
In hybrid and cloud-connected environments, network visibility is especially important because the fault domain often extends well beyond the server itself. Strong monitoring tools therefore correlate network behavior with server and application conditions rather than showing isolated counters.
Processes
Processes and services are among the most actionable server monitoring targets because they directly reflect whether the workload is functioning. A healthy operating system is not useful if a critical process is hung, crashing, or consuming abnormal resources.
eG Enterprise monitors process and service health and can alert teams when a key process fails. This is essential for infrastructure teams that want to move from passive observation to proactive service assurance.
Common Server Performance Problems
Server performance issues usually fall into familiar patterns. Good monitoring helps teams identify the category early and focus their investigation where it matters most.
Resource Exhaustion
Resource exhaustion occurs when CPU, memory, storage, or other capacity limits are pushed too far. This can lead to slow transactions, queue buildup, failed processes, and service outages.
One reason resource exhaustion is so dangerous is that it often develops gradually. Historical trending and predictive analysis can reveal growth patterns before they become visible incidents.
Networking Issues
Networking issues include poor connectivity, unstable throughput, latency spikes, and path failures. These can interrupt communication between application tiers, delay client access, and create misleading symptoms at the server layer.
Without network-aware monitoring, teams may spend time troubleshooting CPU or memory when the real problem sits elsewhere. That is why unified infrastructure monitoring remains critical.
Hardware Failures
Hardware failures include power supply problems, overheating, memory faults, storage problems, and component degradation. These failures can be catastrophic if they are not detected early enough for intervention.
Hardware-aware monitoring is particularly important for enterprise teams managing mixed vendor estates. The ability to see hardware health independently of operating system symptoms can significantly reduce outage risk.
Configuration Errors
Configuration issues can cause server performance problems even when capacity appears adequate. Misconfigured services, weak tuning, drift across environments, or incompatible changes can degrade workload behavior and make incidents harder to diagnose.
Because configuration issues are often subtle, they are easiest to detect when teams can compare baseline behavior over time and correlate changes with performance shifts.
What Enterprises Need in 2026
Enterprise requirements for server monitoring have evolved well beyond simple uptime checks. Teams now need tools that support hybrid architectures, cloud-connected workloads, shared service ownership, and increasingly strict expectations around user experience and application performance.
That means the best tools in 2026 must detect resource issues and also help teams understand whether a server problem is affecting business-critical applications, whether the issue is local or systemic, and whether trend data suggests a bigger capacity or architecture problem ahead.
Unified Monitoring vs Point Monitoring Tools
Many organizations still use separate tools for hardware, operating systems, cloud instances, and application performance. That approach can work in smaller environments, but in enterprise settings it often creates silos that slow down troubleshooting and make ownership less clear.
Unified monitoring platforms reduce this friction by allowing teams to view different server layers and related workloads through one model. eG Enterprise uses a layered representation and a single pane of glass for heterogeneous server farms, which illustrates why unified tooling remains valuable in modern operations.
Reporting and Capacity Planning
Historical reporting is one of the most important features in any enterprise server monitoring tool because it transforms raw operational data into planning insight. Trend reports can reveal gradual CPU growth, memory pressure over time, recurring disk bottlenecks, and service instability that would be easy to miss in real-time views alone.
Capacity planning also benefits from this evidence because server estates rarely fail without warning. More often, they show a pattern first. Tools that capture and report on those patterns help organizations avoid reactive expansion and improve long-term infrastructure efficiency.
Best Enterprise Server Monitoring Tools
The best enterprise server monitoring tools in 2026 are those that combine broad coverage, operational simplicity, strong analytics, and clear root-cause direction. They must support heterogeneous environments, monitor both infrastructure and service health, and help teams move from raw telemetry to action quickly.
Key capabilities to look for include:
- Support for multiple operating systems such as Windows, Linux, AIX, Solaris, and HP-UX.
- Monitoring of CPU, memory, disk, network, event logs, services, processes, and hardware.
- Agent-based and agentless options to balance depth and deployment flexibility.
- Historical reporting and capacity planning support for proactive operations.
- Correlation between application performance and server performance so incidents can be prioritized by business impact.
- Built-in alerting and thresholds, ideally with automatic thresholding or baseline support.
- Automation hooks or built-in remediation options for recurring operational tasks.
eG Enterprise aligns closely with this enterprise requirement set through unified monitoring, broad OS coverage, hardware integration, layered server visibility, and the ability to monitor applications running on the same servers. That combination is especially useful for teams that need to manage mixed estates without creating separate monitoring silos.
Choosing the Right Server Monitoring Platform
Choosing a server monitoring platform starts with environment fit. Enterprises should assess whether the tool can cover their full estate, including physical servers, virtual machines, cloud instances, and different operating systems.
Next comes operational depth. A server monitoring platform should not stop at showing counters. It should help teams understand which services are affected, whether performance is normal for the workload, how trends are changing, and what the likely root cause is.
Finally, scalability and usability matter. In a large enterprise, the best platform is one that allows different teams to work from a common operational model rather than forcing each team to interpret infrastructure in isolation.

Server Monitoring Best Practices
- Monitor infrastructure and application context together so teams can connect server issues to business service impact.
- Track CPU, memory, disk, network, process health, and hardware as a combined baseline, not separate silos.
- Use synthetic monitoring to continually test and benchmark server availability.
- Use historical reporting to identify recurring bottlenecks and plan capacity before users are affected.
- Support heterogeneous server farms from one monitoring model to reduce operational fragmentation.
- Use thresholding and automated alerting carefully so the signal remains actionable.
- Adopt remediation workflows for repetitive issues where safe automation can reduce response time.
Alerting and Remediation
Strong server monitoring tools need alerting that is both timely and useful. Too many alerts create alert storms and fatigue, but too little sensitivity allows serious issues to go unnoticed. The right balance comes from combining thresholds, baselines, and service context so teams can distinguish real incidents from harmless variation.
Remediation capability adds another operational advantage. eG Enterprise supports built-in scripts for actions such as killing rogue processes or rebooting servers, showing how enterprise monitoring is moving closer to assisted operations rather than passive observation alone.
Cross-Team Visibility for Server Monitoring
Server incidents often involve multiple teams, especially when servers support line-of-business applications, databases, middleware, or digital workspace platforms. A useful monitoring platform should therefore help infrastructure, application, and operations teams work from the same evidence instead of defending separate tools and interpretations.
This cross-team visibility is one of the strongest arguments for unified monitoring. When server health, process state, hardware context, and application relationships are visible together, escalation cycles become shorter and root-cause analysis becomes less political and more factual.
Future Trends
Server monitoring is becoming more intelligent and more predictive as enterprises deal with larger, more distributed environments. The trends shaping 2026 are less about collecting more data and more about making that data more actionable.
AI-powered Monitoring
AI-powered monitoring helps reduce alert noise and highlight unusual behavior by comparing current conditions with established baselines. This approach is especially valuable in large environments where static thresholds generate too many false positives or miss slow-developing issues.
Automatic baselining and self-learning thresholds are examples of this trend. They allow monitoring systems to adapt to real workload patterns instead of depending exclusively on manual tuning.
Predictive Analytics
 Predictive analytics is becoming a core capability because it helps teams forecast resource depletion, identify future bottlenecks, and justify capacity investments using evidence rather than intuition.
This is particularly relevant in hybrid estates where demand patterns can shift rapidly between business cycles, infrastructure migrations, and cloud adoption phases.
Automation in Server Monitoring
Automation is increasingly important for remediation and operational efficiency. eG Enterprise supports built-in scripts for actions such as killing rogue processes or rebooting a server, which illustrates how monitoring is moving beyond detection alone.
Automation should be used thoughtfully, but for recurring incidents it can reduce response time and free operations teams to focus on higher-value work.
Conclusion
The best server monitoring tools for 2026 do more than collect metrics. They are operational platforms that help teams monitor heterogeneous infrastructure, identify performance issues early, correlate technical symptoms with service impact, and plan for growth with confidence.
As infrastructures become more distributed, the need for unified visibility becomes even more important. Enterprises that choose tools with broad coverage, strong analytics, and clear troubleshooting workflows will be better prepared to reduce downtime and improve service reliability across every server environment they manage.
You can learn more about the latest enhancements in eG Enterprise for server monitoring, in another article, see: Taking Server Monitoring to the Next Level | eG Innovations.
See how eG Enterprise can help you monitor every server environment from one unified platform – schedule a demo today.
eG Enterprise is an Observability solution for Modern IT. Monitor digital workspaces,
web applications, SaaS services, cloud and containers from a single pane of glass.
Frequently Asked Questions
Server monitoring is the continuous tracking of server availability, health, resource usage, service state, and performance over time so IT teams can detect faults and protect workload reliability. Effective server performance monitoring spans physical, virtual, and cloud servers, and links infrastructure symptoms to the applications and business services that depend on them.
CPU, memory, disk, network, process health, service availability, and hardware indicators are among the most important server monitoring metrics. The right priority depends on the workload, but together these metrics show whether a server is healthy, whether the workload is stable, and whether there is enough capacity headroom to hold performance.
Servers should be monitored continuously, with real-time alerting for incidents and regular historical review for trend analysis, capacity planning, and optimization. Continuous collection catches sudden faults as they happen, while scheduled weekly or monthly reviews of historical data reveal slow-developing problems, such as gradual resource growth, before they affect users.
Common causes include resource exhaustion, failed services or processes, hardware faults, network issues, and configuration errors. Many of these build gradually rather than all at once, so continuous monitoring with historical trending and early alerting helps teams intervene before a minor issue turns into a full outage.
Yes. Enterprise monitoring platforms can monitor physical, virtual, and cloud-hosted servers together, and eG Enterprise specifically provides unified visibility across heterogeneous server farms and cloud-connected environments. Using one platform across every environment removes the blind spots and hand-offs that appear when separate tools cover different parts of the estate.
The solutions that scale best are generally those with broad OS coverage, unified dashboards, historical analytics, and the ability to monitor mixed infrastructures from one operational model. Scalability also depends on how well a platform handles growing data volumes and lets multiple teams work from the same console without added tooling.
Use a monitoring platform built for heterogeneous environments, with support for both operating systems, a consistent data model, and centralized alerting and reporting. eG Enterprise uses a layered representation model to simplify cross-platform monitoring, so teams can compare and correlate Linux and Windows performance in one view instead of switching between separate tools.
Proactive server monitoring means identifying abnormal behavior early through continuous monitoring, thresholds or baselines, historical trend analysis, and preemptive remediation before end users are affected. Rather than waiting for complaints, teams act on early warning signs, such as rising resource use or recurring bottlenecks, to prevent incidents and reduce downtime.