English


A trader waits 50 seconds for a Citrix session to load while the market moves. A clinician steps away from a patient because the virtual desktop froze mid-record. A call-center agent watches keystrokes lag every customer question. None of these people file a detailed bug report. They contact the helpdesk, reporting that “Citrix is slow,” and lose minutes of productive time, multiplied across thousands of users every day.
That is the real cost of a slow session, and it is why Citrix monitoring tools have become essential infrastructure rather than a nice-to-have. The right Citrix monitoring tools give IT teams visibility into what users experience, then point to the root cause fast enough to fix it before the business feels the impact.
The challenge is that Citrix performance depends on dozens of moving parts. Logon involves Active Directory, profile loading, and group policy. Sessions ride on the network, the hypervisor, storage, and the applications inside the desktop. When any one layer degrades, the user blames Citrix. Without end-to-end visibility, IT teams spend hours guessing where the problem lives.
What Is a Citrix Monitoring Tool?
A Citrix monitoring tool is software that continuously measures the health, performance, and user experience of a Citrix virtual apps and desktops environment (formerly XenApp and XenDesktop) and the infrastructure that supports it. It tracks what users feel, not just whether servers are up.
Core Functions of Citrix Monitoring Tool
At its core, a Citrix monitoring tool collects performance data across every stage of a session: logon, application launch, and in-session interaction. It baselines normal behavior, alerts on deviations, and provides the diagnostic detail teams need to troubleshoot. Good tools combine real-time monitoring with historical reporting so you can both react to incidents and plan ahead.
Components Monitored in Citrix Infrastructure
A complete view spans the full Citrix stack and its dependencies: Citrix StoreFront, NetScaler, Delivery Controllers, Provisioning Services, license activation services, and the virtual app servers and desktops themselves. It also reaches the non-Citrix tiers that affect experience, including Active Directory, the hypervisor, storage, network, and the applications running inside each session.
Benefits of Proactive Citrix Monitoring
Proactive monitoring shifts IT from firefighting to prevention. Instead of waiting for users to complain, teams catch a slow logon trend or a memory leak before it spreads. The payoff shows up as fewer tickets, faster resolution, steadier user experience, and better-informed capacity decisions.
Key Metrics a Citrix Monitoring Tool Should Track
Citrix user experience is not one number. It is a chain of measurable stages, and a capable Citrix monitoring tool tracks each one so you can pinpoint exactly where time is lost.
User Logon Performance
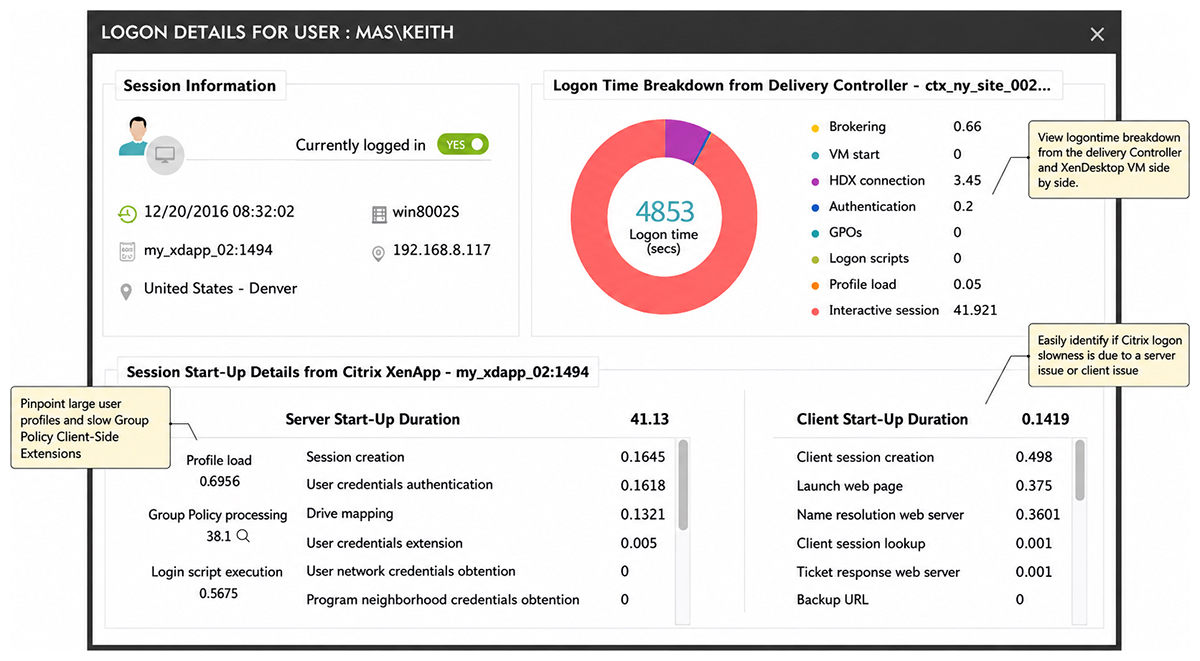
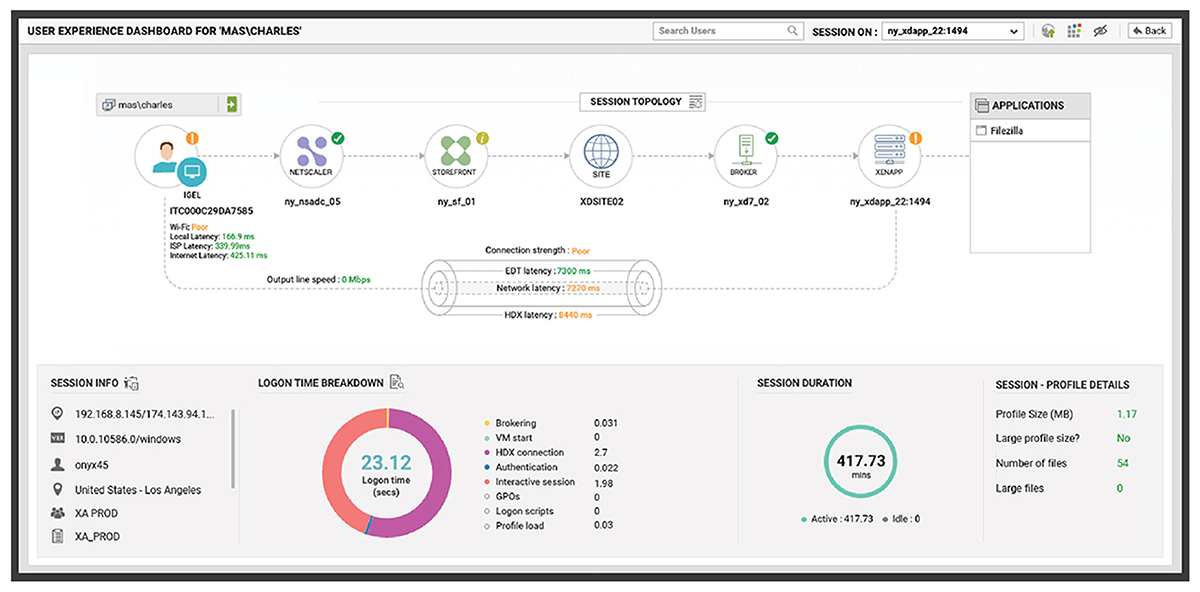
Logon is where frustration starts. A useful tool breaks total logon time into its components: authentication, profile load, group policy processing, and session establishment. When logons slow down, that breakdown tells you whether the cause is Active Directory, a bloated profile, GPOs, or a script, instead of leaving you to guess.
ICA Latency and Session Reliability
The ICA/HDX/EDT protocol channels carries the user’s actual interaction with the session. Screen refresh latency, client network latency, and bandwidth usage reveal how responsive the session feels. Tracking disconnects and reconnects matters too, because a session that drops repeatedly destroys productivity even when servers look healthy.
Server and Hypervisor Utilization
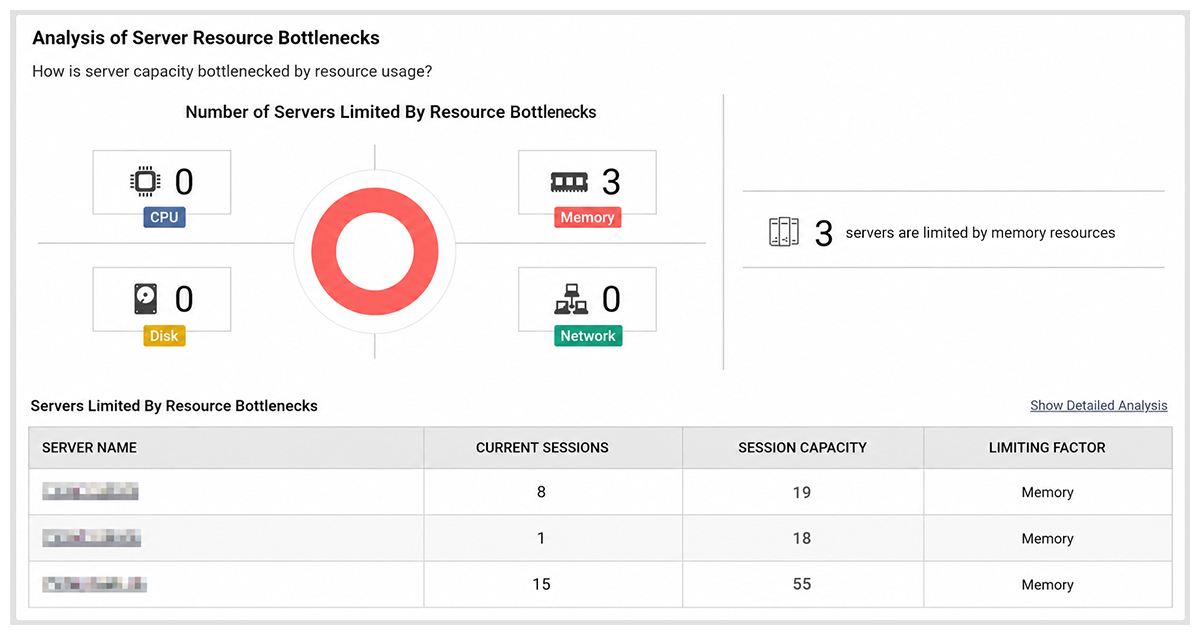
Virtual app servers and desktops share finite host resources. Monitoring CPU, memory, disk I/O, and GPU at both the guest and hypervisor level shows when one workload is starving its neighbors. This visibility is what separates a real diagnosis from simply adding more hardware and hoping.
Application Performance Within Citrix Sessions
Users launch applications inside their sessions, and a single misbehaving app can drag down the whole experience. Tracking application launch time, resource consumption per app, and crashes or hangs helps teams find the specific application, not just the server, responsible for a slowdown.
Common Citrix Performance Problems
Most Citrix complaints trace back to a familiar set of issues. Knowing the patterns helps teams resolve them faster.
Slow User Sessions
Slow sessions usually come from logon delays or in-session latency. The trap is assuming the Citrix server is at fault. Often the real cause sits upstream in authentication, profile storage, or a spotty user-side network connection.

Application Freezing and Crashes
When an application freezes, the cause may be a memory leak, resource contention, or a backend dependency such as a slow database query. Over-provisioning will not fix a leak. Only finding and addressing the root cause makes the problem go away for good.
Network Bottlenecks
Because all keystrokes and screen updates travel between the endpoint and the data center, network latency, jitter, and packet loss translate directly into a poor session. Distinguishing network latency from server-side delay is one of the hardest and most valuable things a monitoring tool can do.
Resource Contention in Virtual Environments
On a shared host, one VM consuming excess CPU, memory ballooning, or storage I/O can degrade every session on that host. Visibility across the virtual and physical layers is essential to spot contention and rebalance workloads before users notice.
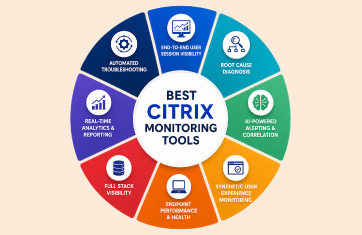
Essential Features of an Enterprise Citrix Monitoring Tool
Not every tool is built for the demands of a large Citrix estate. A few capabilities separate a basic checker from an enterprise-grade Citrix monitoring tool.
Real User Experience Monitoring
The tool should measure the experience of real users in live sessions, plus synthetic tests that simulate logons and full sessions when no one is logged in. Together these confirm both how the service feels right now and whether it is ready before the workday begins.
Full Stack Visibility Across Infrastructure
Monitoring the Citrix tiers alone is not enough, because the cause of “Citrix is slow” frequently lives outside Citrix. Full-stack visibility, from the endpoint through the network, Citrix tiers, virtualization, storage, and Active Directory, in a single view is what lets teams stop pointing fingers across silos.
AI-Powered Root Cause Analysis
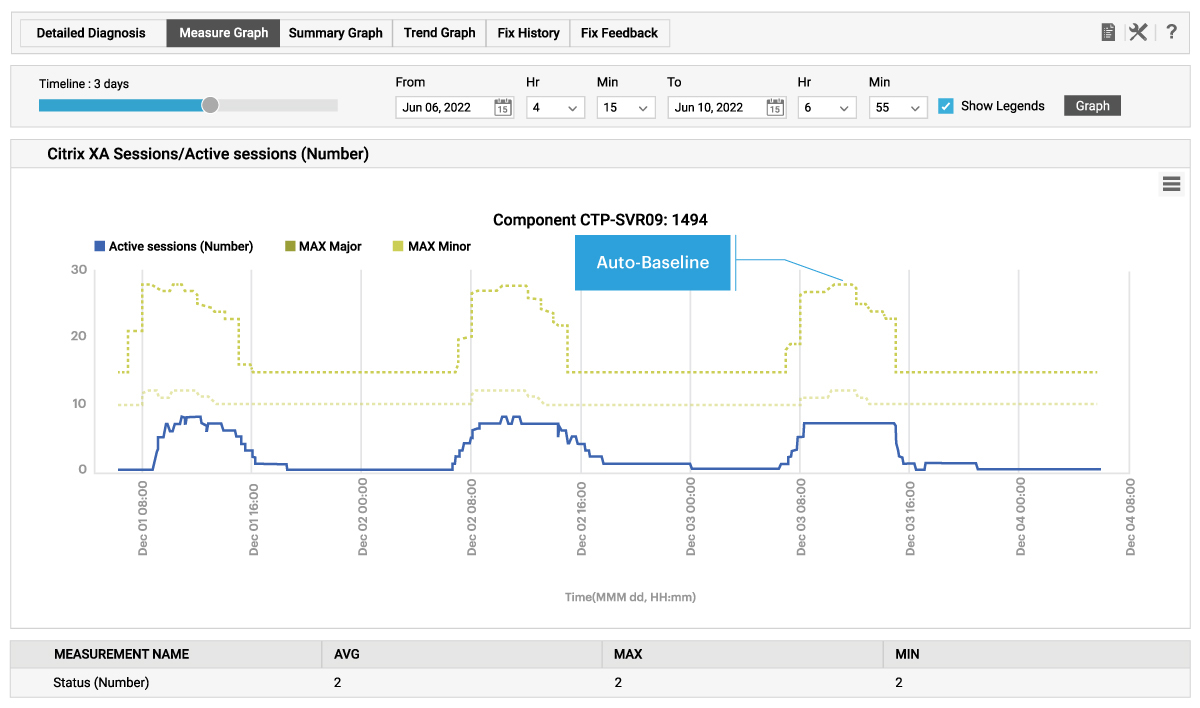
With hundreds of metrics in play, manual correlation does not scale. Tools that apply machine learning and automated correlation can auto-baseline normal behavior and surface the most likely root cause, cutting diagnosis from hours to minutes.
Automated Alerting and Reporting
Smart alerting reduces noise by flagging genuine deviations rather than every threshold breach. Learn more about best practices for setting metric thresholds and alerts, see: White Paper | Make IT Service Monitoring Simple & Proactive with AIOps Powered Intelligent Thresholding & Alerting.
Built-in reports support capacity planning, right-sizing, and audit needs, turning raw monitoring data into decisions.
Benefits of Using Advanced Citrix Monitoring Solutions
The features matter because of the outcomes they produce for IT teams and the business.
Faster Problem Resolution
When a tool isolates the failing tier automatically, mean time to mean time to resolution drops sharply. Teams fix the actual cause on the first attempt instead of cycling through theories.
Improved Employee Productivity
Fast logons, responsive sessions, and fewer disconnects mean users spend their time working, not waiting or rebooting. Across a large workforce, that recovered time is significant.
Reduced Downtime and Helpdesk Tickets
Catching issues proactively prevents outages and heads off the wave of “Citrix is slow” tickets that consume helpdesk capacity. Fewer tickets free skilled staff for higher-value work.
Better Capacity Planning
Historical performance data shows when servers will run out of headroom and which VMs are over- or under-provisioned. Teams can right-size with evidence and avoid both shortages and wasted spend.
How eG Innovations Supports Citrix Monitoring
eG Enterprise is purpose-built for Citrix environments, drawing on more than two decades of monitoring experience across many of the world’s largest Citrix deployments.
Deep Citrix Integration
eG Enterprise monitors every Citrix tier out of the box, including Citrix Virtual Apps and Desktops (CVAD), NetScaler, StoreFront, Delivery Controllers, Provisioning Services, license activation services, Workspace Environment Management, and App Layering. It captures detailed ICA and HDX/EDT performance analytics across user sessions.
End-to-End Dependency Mapping
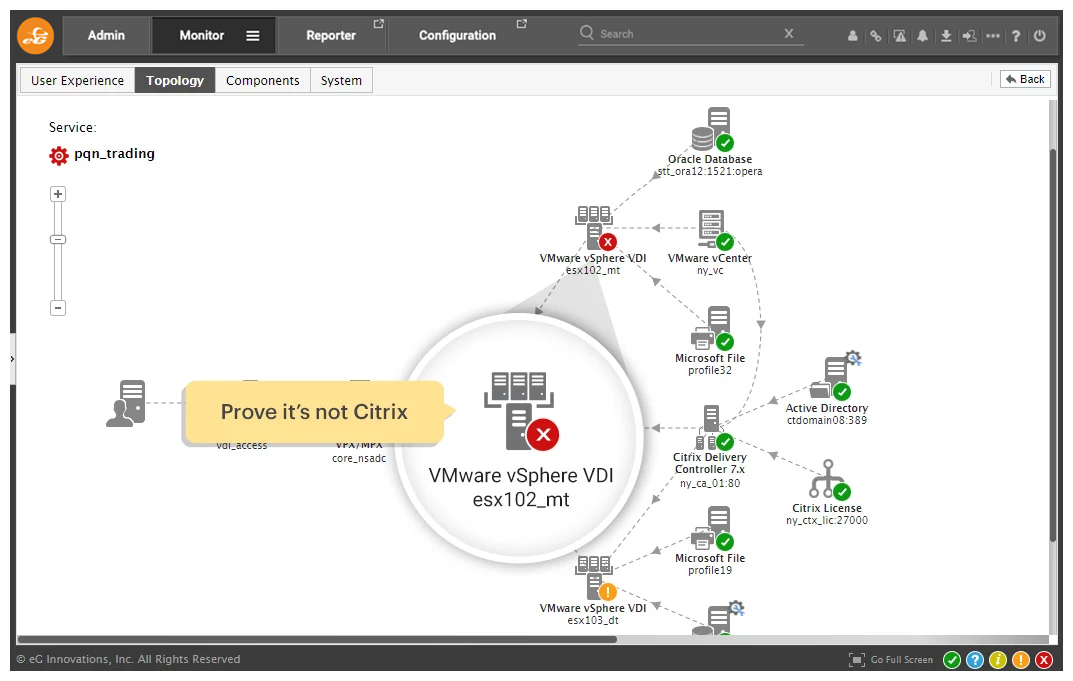
Using automated, virtualization-aware correlation, eG Enterprise maps the dependencies between Citrix tiers and the supporting infrastructure. Service topology views help teams understand whether an issue is likely originating in Citrix, VMware, storage, Active Directory, cloud infrastructure, or the network.
Automated Performance Diagnostics
eG Enterprise auto-baselines normal behavior and applies machine learning and AIOps to surface the root cause of performance issues, so teams diagnose faster and act before users are affected. It supports more than 650 technologies, extending the same unified view well beyond Citrix.
Unified Monitoring Dashboard
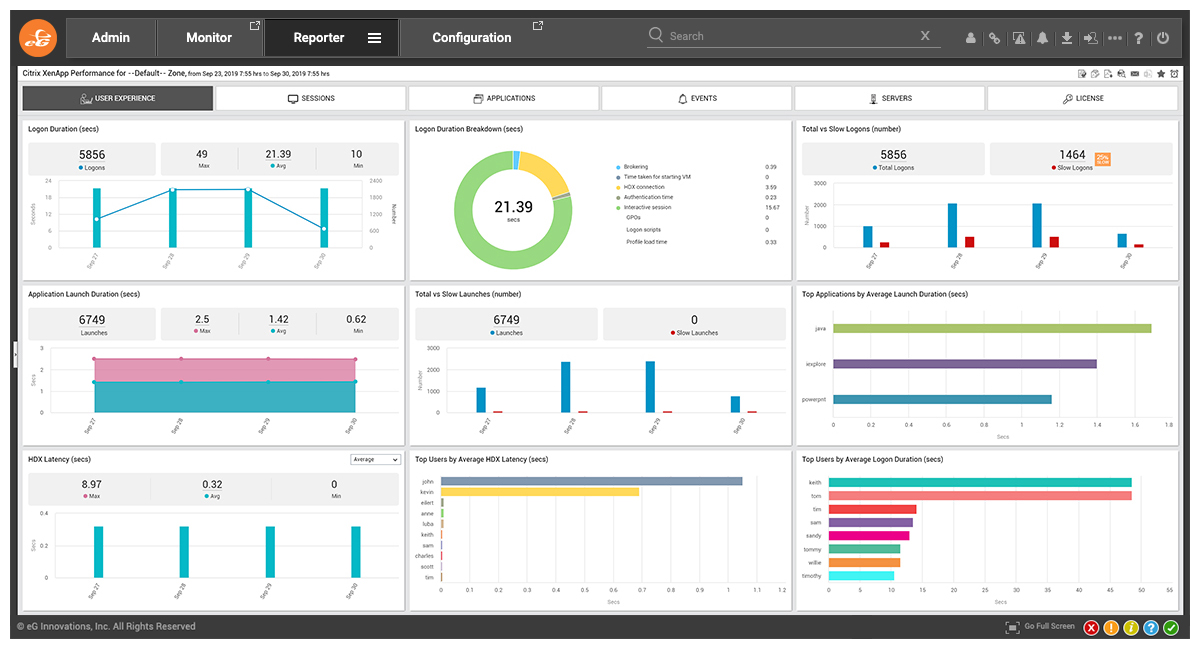
From a single pane of glass, administrators monitor real user experience, every Citrix tier, and every supporting layer together. Built-in dashboards, customizable reports, and proactive alerting make it straightforward to find and fix bottlenecks quickly.
Conclusion
Slow Citrix sessions are not just a technical annoyance. They are a direct tax on productivity, paid every day across every user who waits, reconnects, or calls the helpdesk. The way to stop paying it is visibility: knowing what users experience and why, across the entire stack.
That is exactly what modern Citrix monitoring tools deliver. They turn “Citrix is slow” from a guessing game into a fast, evidence-based diagnosis, optimize virtual desktop performance, and free IT teams to prevent problems rather than chase them.
See how eG Enterprise gives you end-to-end visibility across your Citrix environment and 650+ other technologies. Request a demo or start a free trial.
eG Enterprise is an Observability solution for Modern IT. Monitor digital workspaces,
web applications, SaaS services, cloud and containers from a single pane of glass.
Frequently Asked Questions
A Citrix monitoring tool continuously measures the performance and user experience of a Citrix environment. It tracks logon times, session latency, application performance, and the health of supporting infrastructure, then alerts teams to problems and provides the diagnostic detail needed to find and fix the root cause quickly.
The most important metrics include logon time and its breakdown, ICA/HDX screen refresh and network latency, session reliability and disconnects, application launch time, and resource utilization across servers, hypervisors, and storage. Tracking these together shows exactly where a session slows down.
Citrix monitoring improves user experience by detecting slowdowns before users are affected. By measuring real session performance and alerting on deviations, IT teams can fix logon delays, latency, and resource issues proactively, keeping sessions fast and reliable instead of reacting after complaints arrive.
Citrix performance depends on many tiers, including network, Active Directory, virtualization, and storage. The cause of a slow session often sits outside Citrix itself. End-to-end visibility lets teams see every layer in one place, so they can pinpoint the true root cause instead of guessing across silos.
Yes. By automatically correlating performance data across all tiers and isolating the failing component, a Citrix monitoring tool removes manual guesswork. Teams move from hours of cross-team investigation to a clear answer in minutes, which lowers mean time to resolution and reduces repeat tickets.