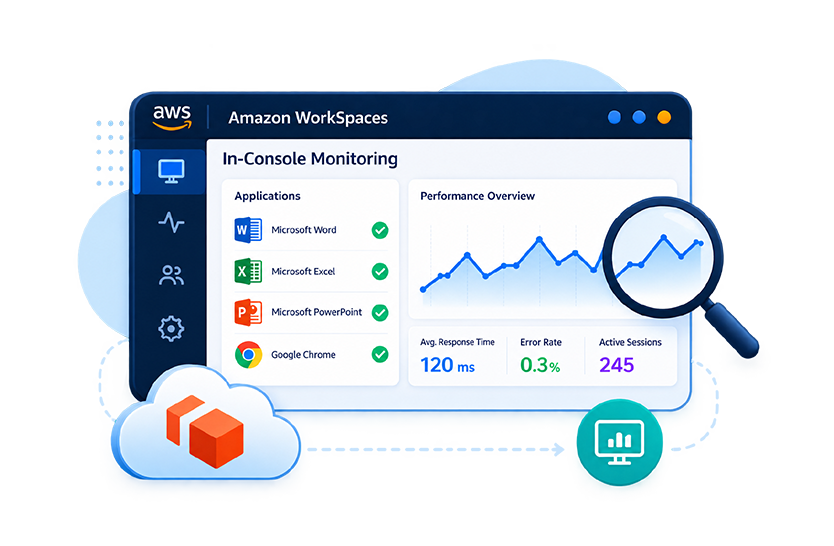
Recently, Amazon announced WorkSpaces Applications in-console monitoring. This is a big shift forward for AWS, who is quietly building market share with their Amazon WorkSpaces Applications (previously called Amazon AppStream 2.0) virtual applications offering. This announcement validates that observability matters for Amazon WorkSpaces Applications customers – they need to see what’s going on in their virtual application and desktop fleets, hosts and sessions.
Amazon’s Observability Gap
Until now, all the popular digital workspace technology vendors had a native observability offering. Citrix has several tools including Citrix Director, Citrix Uber Agent, Citrix Analytics and so on to cover different observability needs for customers. Microsoft Azure offers Azure Monitor for collecting metrics about the Azure Virtual Desktop service. Omnissa offers Workspace ONE for DEX and Omnissa Monitor for infrastructure monitoring. In comparison, Amazon had no out of the box dashboard for monitoring Amazon WorkSpaces Applications Sessions and hosts.
Over the last year, Amazon has added capabilities to cover the gap to an extent. The in-console monitoring graphs provide an automatic CloudWatch dashboard with graphs created the moment you configure the service. Previous enhancements a few months earlier deliver CloudFormation templates for fleet-level and per-user dashboards, and a template that stands up six CloudWatch alarms with SNS email notification against a named fleet.
These investments are a signal that streamed application delivery is now business-critical and customers are asking hard questions about user experience, and AWS has answered with better native instrumentation and dashboarding.
So, the question for anyone running Amazon WorkSpaces Applications at any reasonable scale (hundreds to thousands of users) is what falls outside its frame, and whether that gap matters in your environment. Spoiler alert – it probably does.
What The Native Amazon Tooling Gives You For Monitoring Amazon WorkSpaces Applications
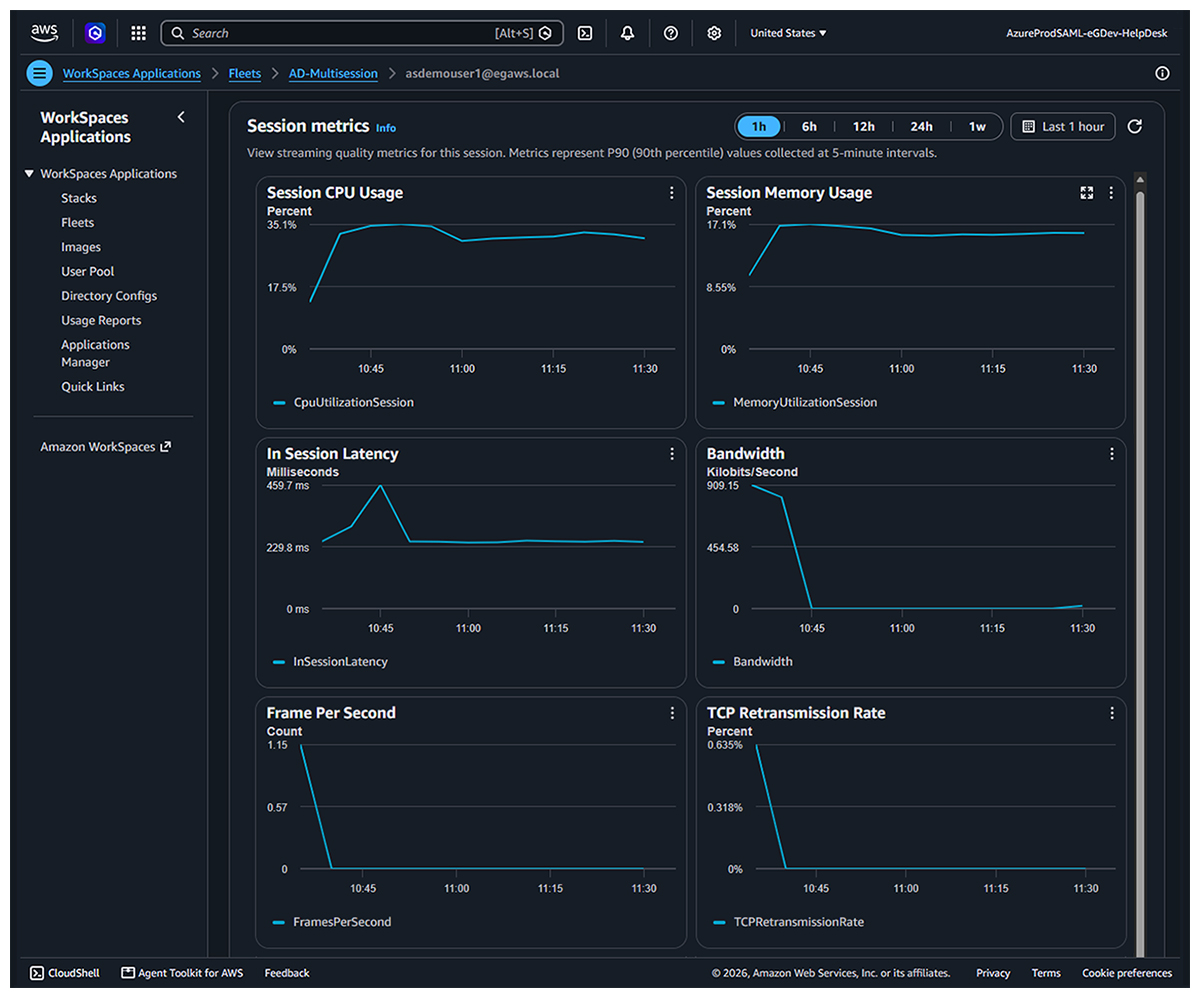
This native tooling is a start. It includes the details below:
| Fleet capacity metrics for capacity decisions and scaling alarms | ActualCapacity, AvailableCapacity, DesiredCapacity, InUseCapacity, PendingCapacity, CapacityUtilization, and InsufficientCapacityError — plus the session-slot equivalents for multi-session fleets and three drain-mode metrics. |
|---|---|
| Instance and session performance | CpuUtilizationInstance, MemoryUtilizationInstance, PagingFileUtilizationInstance, DiskUtilizationInstance, DiskReadOperations, DiskWriteOperations, and the per-session CPU and memory equivalents. |
| Session quality | InSessionLatency, UDPPacketLossRate, TCPRetransmissionRate, Bandwidth, BandwidthInbound, CongestionWindow, ConnectionDuration, and FramesPerSecond. Dimensions run down to [FleetName, InstanceId, SessionId, UserId], so you can find an individual user’s session. |
For an administrative, native tooling helps them answer the operational questions such as “who is logged in”, “what resources are they consuming”, “what latency are they experiencing”, “is there a resource crunch on the session hosts”, etc. User session vs. host metrics can be seen together without needing any setup and configuration.
Where the Gap in Amazon WorkSpaces Applications Monitoring Really Exists
Three boundaries define what the AWS/AppStream namespace can and cannot tell you. Not flaws, but consequences of what the service is instrumented to observe.
The metrics describe the session, not the complete user experience
Go through the full published metric set — single-session fleet usage, multi-session fleet usage, and instance and session performance — and there is no logon duration metric. No application launch time. No user input delay. No profile load time. No GPU metric of any kind.
That matters because it is based on user experience where users form their judgement of the service. For example, logon is the single most common source of “it’s slow” tickets in any streamed environment. A session that starts in eleven seconds and one that starts in ninety seconds produce identical ConnectionDuration and InSessionLatency readings once the user is in. The pain happens before the metrics start.
The same applies inside the session. CpuUtilizationSession tells you the session is consuming 94% of allocated compute. It does not tell you which application is doing it, or which user process to look at. For graphics-heavy workloads — CAD, imaging, video — the absence of GPU metrics leaves the most expensive part of the instance un-instrumented.
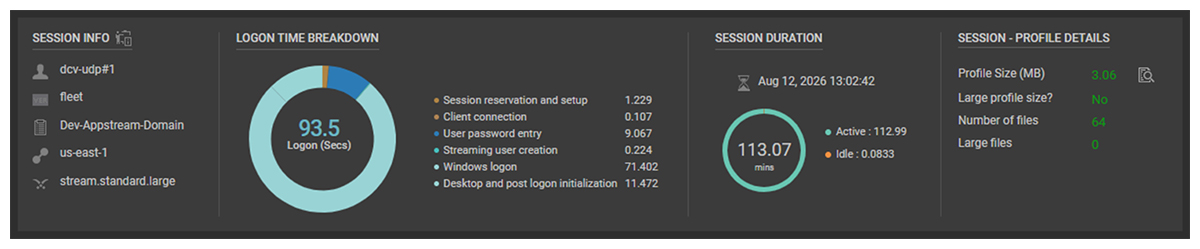
eG Enterprise measures all aspects of user experience. eG Enterprise measures logon as a broken-down sequence, tracks application launch time and user input delay per session, identifies the processes and applications consuming CPU, memory and GPU inside the instance, and reports Amazon DCV (was NICE DCV) protocol metrics per session — including bandwidth by virtual channel, so you can see whether a user’s problem is display, audio, clipboard or file redirection. And the data is available in real-time and historically. The new Amazon WorkSpaces Applications dashboard shows the sessions and hosts that are currently active, not ones that were present a few hours ago.

The metrics stop at the AWS account boundary
This is the larger point, and it is the one that decides most evaluations.
A streamed application is delivered by a chain. Some of that chain runs in your AWS account, but so much of it doesn’t: Active Directory, whether on-premises or hybrid, the identity provider handling SAML, print servers, etc. The line-of-business middleware the streamed application connects back to is quite often still on-premises. Direct Connect or the site-to-site VPN carrying that traffic affects user experience as well. And at the far end, the user’s endpoint, their local network, and their home Wi-Fi.
CloudWatch metrics for WorkSpaces Applications are dimensioned by Fleet, InstanceId, SessionId and UserId. They cannot report on a domain controller in your data centre, a profile share that has run out of IOPS, or a Direct Connect circuit that is saturated at 4pm on a Tuesday. Those components will still ruin the user’s day.
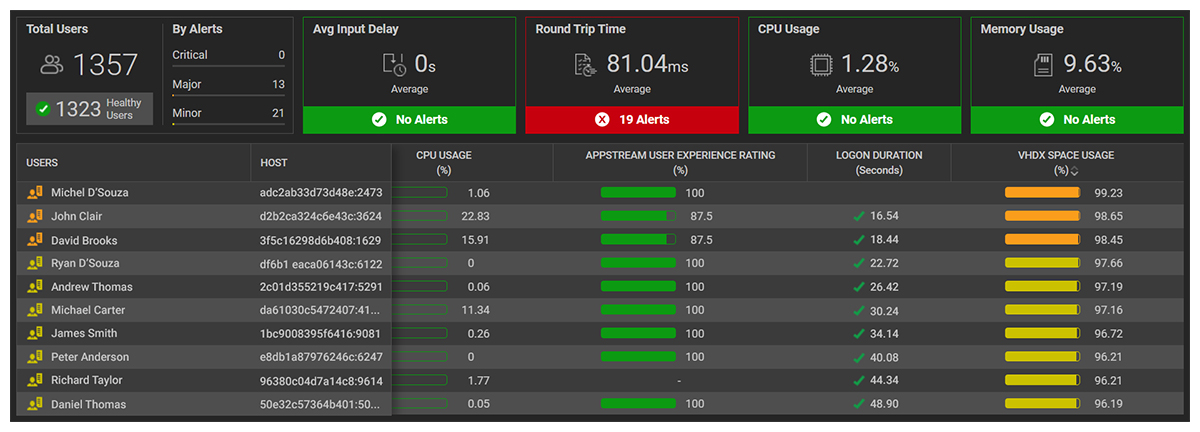
This is the single strongest reason to run a platform-independent monitoring layer alongside native tooling. eG Enterprise integrates with CloudWatch to collect the AWS-native metrics and monitors the rest of the chain in the same console — profile servers, Active Directory, storage, network, the on-premises application and database tiers, and the endpoint itself. Over 650 application and infrastructure technologies are supported from a single console.
Collection is not correlation
Native tooling gives you accurate numbers. What it does not do is tell you which number caused the others.
When InSessionLatency climbs and FramesPerSecond drops and CpuUtilizationInstance spikes, you have three alarms and a triage problem. Somebody senior now spends an hour working out the order of events. Industry service management experience puts roughly 80% of the time between a problem occurring and its resolution into isolating the cause — only about 20% goes on the fix.
eG Enterprise applies patented auto-correlation across every layer of every tier, with machine-learning auto-baselining to establish what normal looks like without administrators hand-setting thresholds. It separates cause from effect and points at the origin. Automated diagnosis fires in context and stores the detail, so post-mortem analysis does not depend on the affected instance still being available.
No users means no metrics
Instance and session metrics are collected at a five-minute interval, and the first data point appears within five minutes of a session being provisioned. Sensible — but it means the metrics only exist when someone is already logged in. At 5am, before the first shift, the service could be broken and the dashboards would be quiet.
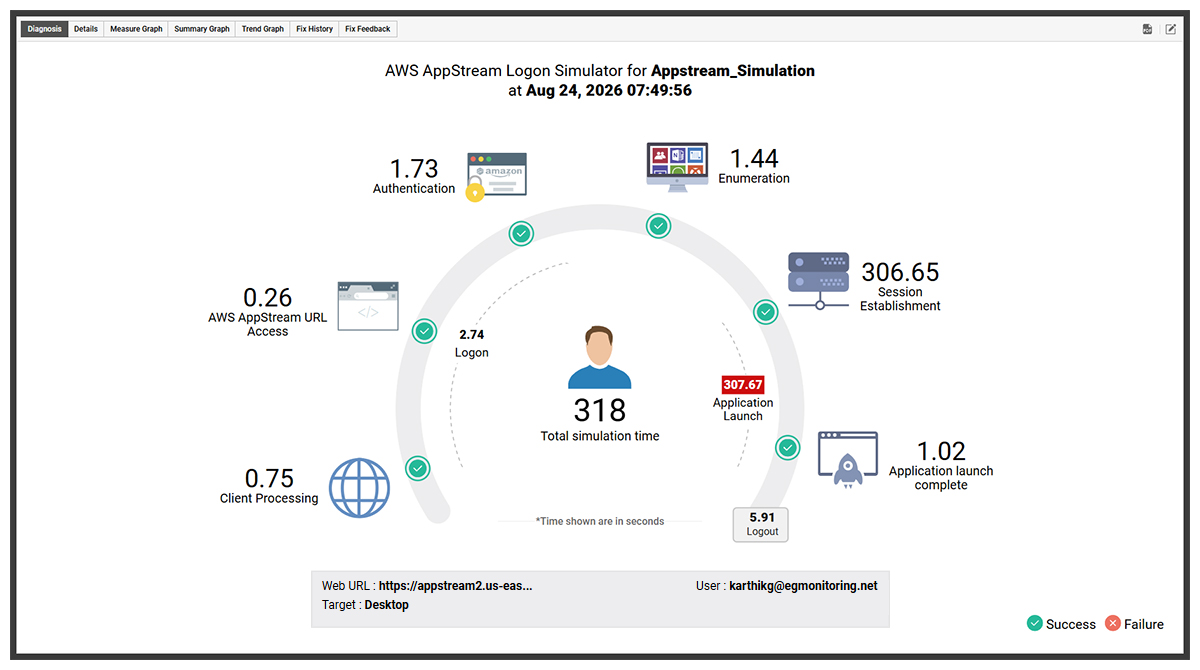
The eG AWS Logon Simulator targets the WorkSpaces Applications web client logon URL from a standard Chrome desktop and launches applications on a schedule, 24×7, at whatever interval you set. It needs no script recording. When a step fails, it names the failing step. It works against multi-session and single-session fleets. Run it from several locations and you also get a read on geographic differences in logon performance.

Most organizations do not run one platform
eG Innovations survey data found 54% of organizations have deployed more than one digital workspace technology. If you run WorkSpaces Applications alongside Citrix, Azure Virtual Desktop, Windows 365 or Omnissa Horizon, native tooling gives you a console per platform, each with its own metrics, thresholds and reports, and no shared view.
eG Enterprise reports consistent user experience metrics across all of them in one console. That also makes migration measurable: baseline the incumbent platform before you move, compare after, and hold the business case to account with data rather than assertion.
Observability for all Stakeholders
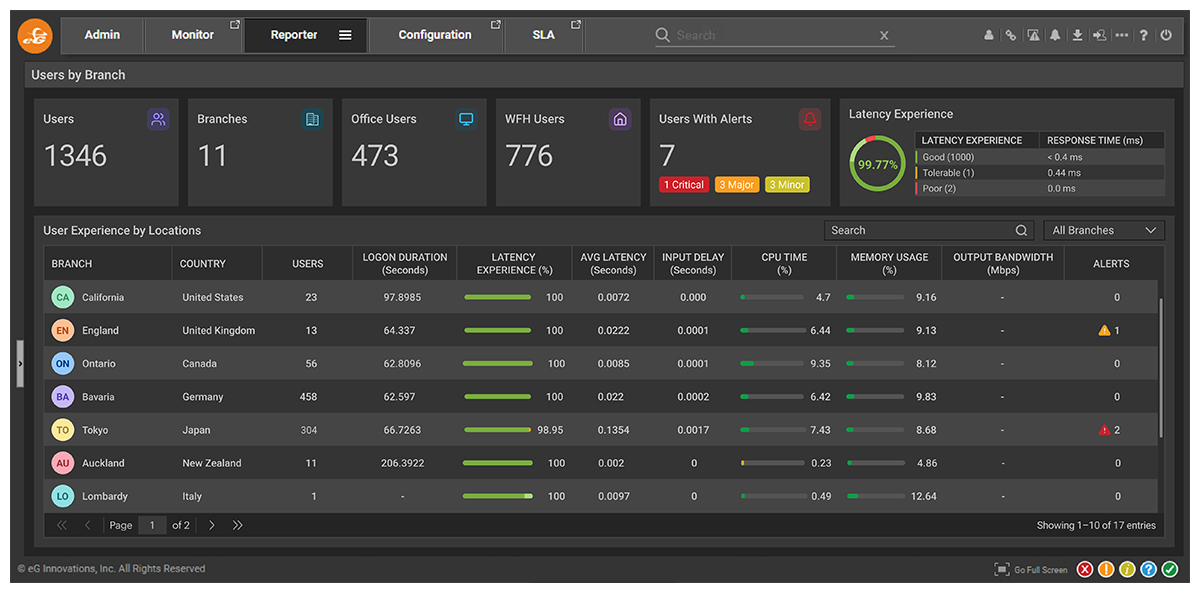
While aggregating logs and metrics across tenants is possible with AWS CloudWatch, it is not the easiest. Often, operating an AWS digital workspace involves liaising with multiple IT experts. Furthermore, IT executives need insights into digital workspace usage and performance. In a managed services context, individual tenants need their respective views. Unlike, AWS CloudWatch which is not ideal to operate in an MSP context, eG Enterprise is fully multi-tenant and supports role-based access control. While MSPs get complete visibility across all tenants, each tenant gets a read-only view of their environment in real-time and for historical analysis. Role-based access can be provided to architects, executives, helpdesk and so on.
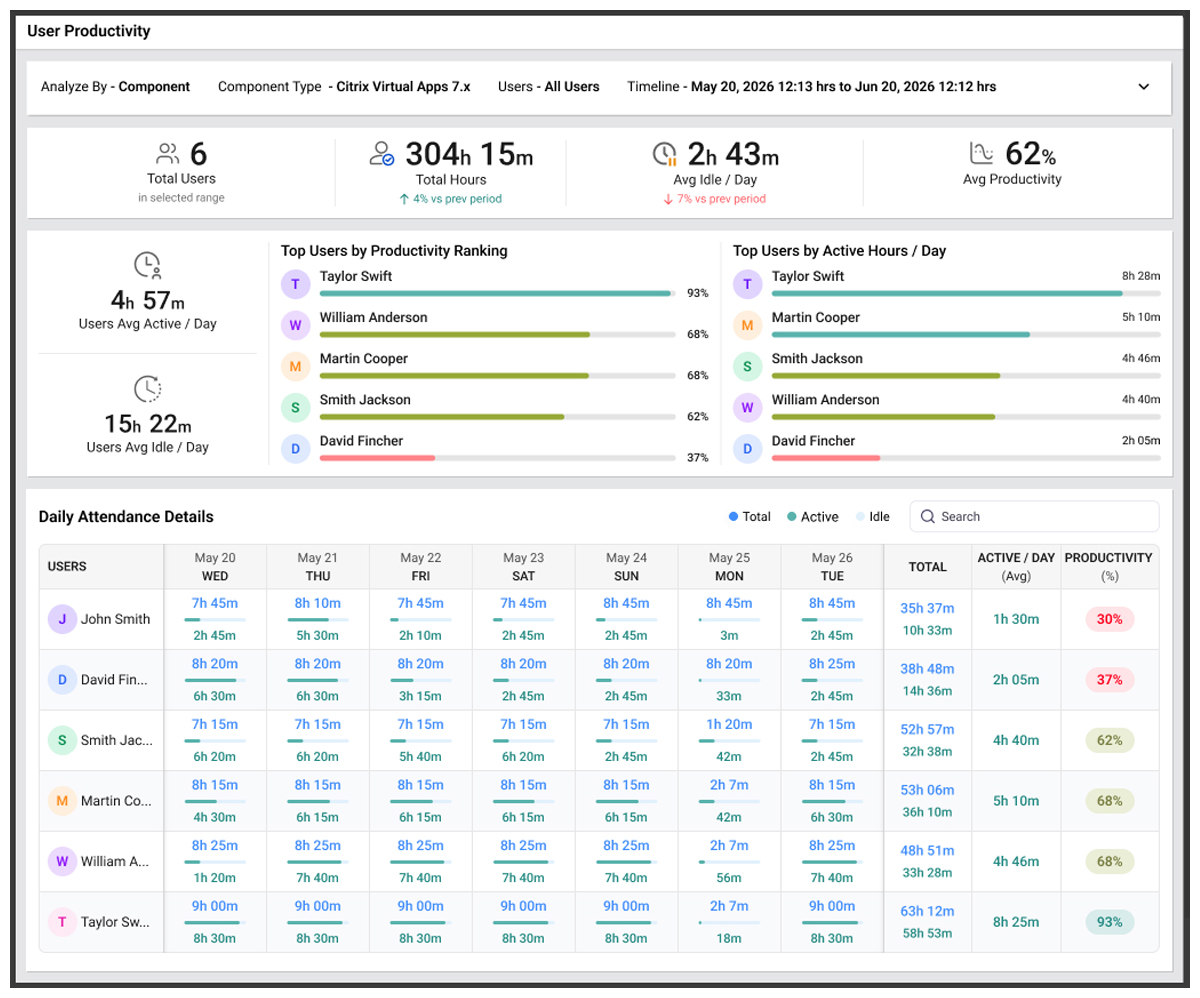
The Benefits of Amazon WorkSpaces Applications Monitoring with eG Enterprise
 A global banking client with several existing monitoring tools measured the change after deploying eG Enterprise. Within eight weeks, time to identify and resolve routine day-to-day performance problems fell by 25–33%. Time to resolve complex multi-domain problems fell by an order of magnitude. The same organization recorded a 15% reduction in technical support staffing levels across a 200-application deployment.
eG Innovations holds AWS Digital Workplace Competency status — one of a small number of observability vendors to have done so — and the eG Enterprise SaaS platform is certified against the AWS Well-Architected Framework.
You can find eG Enterprise Cloud a SaaS offering on the AWS marketplace, here. For on-premises and self-hosted cloud deployment options, please contact us directly.

Where To Start With Amazon WorkSpaces Applications Monitoring
Keep native dashboards for capacity and scaling.
The useful test is narrower and takes about a fortnight: pick one fleet, run the logon simulator against it around the clock, connect eG Enterprise to your CloudWatch metrics, and add the non-AWS dependencies — Active Directory, profile storage, the network path, the back-end application. Then compare what you can explain in two weeks against what you could explain the fortnight before.
If your team is spending real hours a week on streamed application performance tickets they cannot close quickly, that comparison will settle the question either way.
Trial eG Enterprise in your environment today. Visit https://www.eginnovations.com/ and click Free Trial to register.
eG Enterprise is an Observability solution for Modern IT. Monitor digital workspaces,
web applications, SaaS services, cloud and containers from a single pane of glass.
Related Information
Frequently Asked Questions
Amazon WorkSpaces provides a managed, persistent virtual desktop for each user, including their applications, data and personalised settings. Amazon WorkSpaces Applications (formerly Amazon AppStream 2.0) is designed primarily to stream individual applications, or non-persistent desktops, to users through a browser, without requiring a full desktop environment. WorkSpaces is therefore suited to full DaaS deployments and replacing traditional VDI, while WorkSpaces Applications is better for delivering specific applications, including resource-intensive or legacy applications, to a broad range of devices. Both can be used together where users need a complete desktop plus selected streamed applications.
You can monitor Amazon WorkSpaces and Amazon WorkSpaces Applications with eG Enterprise from a single console. It combines AWS/CloudWatch metrics with agent-based monitoring inside the virtual desktops and application hosts, synthetic logon and session monitoring, and user-experience metrics. This provides visibility into resource utilisation, logon and application launch times, network latency, protocol performance, user activity and application performance. eG Enterprise also correlates these metrics across the AWS infrastructure and delivery environment, helping identify whether performance problems originate with the application, desktop, network or underlying AWS resources.
The AWS Digital Workplace Competency is a designation awarded to AWS Partner Network members that demonstrate technical expertise and proven customer success in delivering secure, scalable digital workplace solutions. Partners undergo a rigorous AWS validation process covering their technology, security, architecture, support, documentation and customer outcomes. The competency helps customers identify specialised AWS partners capable of supporting remote work, digital workplace transformation and business continuity. eG Innovations achieved the competency after AWS reviewed eG Enterprise against these technical and operational requirements.
The AWS Well-Architected Framework is a set of best practices from AWS for designing and operating secure, reliable, efficient, cost-effective, and sustainable cloud workloads. It helps organisations evaluate cloud architectures and identify risks before they become problems.
The framework is organised around six pillars:
For monitoring, the framework is particularly relevant because operational visibility, performance monitoring, automated responses and proactive identification of failures help organisations operate AWS workloads reliably and efficiently.
MSPs can monitor Amazon WorkSpaces Applications using eG Enterprise alongside AWS’s native CloudWatch dashboards. eG Enterprise collects AWS metrics for fleet capacity, host resources and session quality, while extending visibility to logon times, application launches, user input delay, processes, GPU, Amazon DCV (formerly NICE DCV) protocol performance and external dependencies such as Active Directory, profiles, storage, networks and backend applications. Its multi-tenant architecture and role-based access controls let MSPs monitor multiple customer environments from one console, with separate real-time and historical views for each tenant.
Organizations operating multiple AWS accounts can centralize monitoring using Amazon CloudWatch cross-account observability features. However, managing large-scale environments and correlating performance across accounts, services and dependencies can become complex. Enterprise observability platforms such as eG Enterprise provide centralized dashboards, role-based access controls and unified reporting across AWS accounts and business units.
GPU utilization metrics are not available as part of the standard Amazon WorkSpaces Applications monitoring metrics. Organizations running graphics-intensive workloads such as CAD, medical imaging, engineering applications or video processing often require additional monitoring capabilities to track GPU utilization, GPU memory consumption and graphics workload performance. The eG Enterprise platform provides detailed monitoring of GPU usage for Amazon WorkSpaces and Amazon WorkSpaces Applications.
Native Amazon WorkSpaces Applications metrics can show that a session or host is consuming high CPU or memory resources, but they do not identify the individual processes or applications responsible. Advanced observability tools such as eG Enterprise can track process-level resource consumption and identify the exact application, service or user process causing performance degradation.
Amazon CloudWatch provides infrastructure and service-level metrics generated by Amazon WorkSpaces Applications. eG Enterprise complements CloudWatch by collecting these AWS metrics while also monitoring user experience, logon performance, application behaviour, Active Directory, network dependencies, storage infrastructure and endpoint health. eG Enterprise additionally provides automated correlation, root-cause diagnosis and cross-platform visibility from a single console.
Troubleshooting slow Amazon WorkSpaces Applications sessions requires visibility across the entire application delivery chain. Start by reviewing CloudWatch metrics for CPU, memory, latency, packet loss and session performance. If those metrics do not identify the root cause, investigate dependencies such as Active Directory, profile services, storage performance, network connectivity, Direct Connect links, VPN connections and backend applications. End-to-end observability tools such as eG Enterprise can correlate these components automatically and accelerate root-cause analysis.
No. Amazon WorkSpaces Applications native monitoring provides visibility into session and host metrics after a session has been established, but it does not provide detailed visibility into user logon duration, profile load time, application launch performance or user input delay. Third-party monitoring platforms such as eG Enterprise can measure and break down logon times, track application launches and identify user experience bottlenecks before and during a session.
No. Native Amazon WorkSpaces Applications monitoring focuses on active user sessions and provisioned resources. If no users are logged in, session-related metrics are unavailable. Synthetic monitoring solutions, such as logon simulation, can continuously test application availability and logon performance around the clock, helping IT teams detect issues before users are affected.