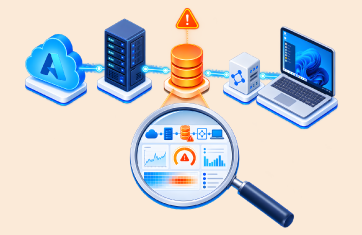

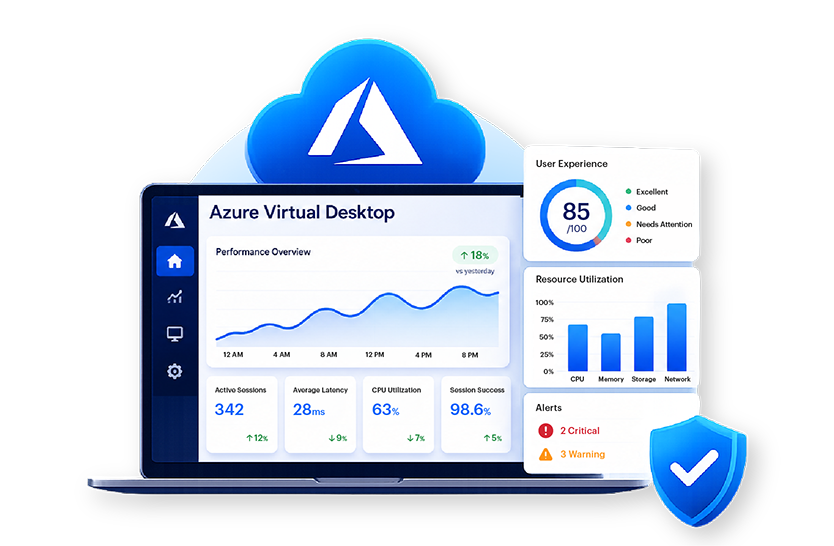
Azure Virtual Desktop (AVD) is rapidly growing in popularity as modern way to deliver virtual desktops and apps to users, with Azure providing the infrastructure as alternative to on-prem VDI environments. As organizations expand their use of AVD in Azure, monitoring becomes critical. While Azure provides the infrastructure, IT teams still need visibility into host pools, session hosts, user sessions, Entra ID, network performance, endpoints, and application responsiveness to ensure a consistent user experience.
Azure Virtual Desktop gives enterprises a flexible way to deliver digital workspaces, but flexibility does not remove complexity. It redistributes that complexity across Azure services, session hosts, identity systems, network paths, profiles, and applications. As a result, monitoring AVD effectively is not just a matter of checking cloud resource health. It requires visibility into the complete service delivery path and the actual experience users have when they log in, launch applications, and work throughout the day.
Ultimately if employees experience issues with slow application or unreliable desktops it is down to the organization who is the AVD customer to process service desk tickets and to troubleshoot and resolve.
AVD Dependencies in Azure
Key Azure services and Microsoft technologies commonly used alongside AVD in Azure include:
- Azure Virtual Machines
- Microsoft Entra ID (formerly Azure Active Directory)
- Active Directory (via Entra ID Connect)
- Azure Monitor
- Azure Storage
- Azure Networking
- Microsoft Defender for Cloud (formerly Azure Security Center)
- Azure Log Analytics
- Azure Advisor
- Microsoft Intune
Because Azure Virtual Desktop depends on many of these services, effective monitoring requires visibility across the wider Azure and Microsoft ecosystem rather than focusing solely on session host or virtual machines.
AVD customers need effective monitoring tools to understand and match their workloads to the appropriately sized Azure Virtual Machines to optimize user densities and minimize costs without compromising performance or user experience.
Understanding Azure Virtual Desktop Monitoring
Azure Virtual Desktop monitoring is the practice of tracking service availability, performance, user experience, and capacity across Microsoft’s cloud-hosted desktop environment. In the enterprise context, it includes monitoring Azure account services, Entra ID, host pools, session hosts, user sessions, application behavior, and the quality of the digital experience delivered to end users.
This is different from simple infrastructure monitoring. A session host can look healthy while users still suffer from poor logons or lagging applications. Similarly, cloud resource metrics may appear normal while a host pool is unevenly loaded or an application is degrading user productivity. Effective AVD monitoring therefore requires both platform visibility and context about the actual user journey.
Azure Virtual Desktop Architecture Overview
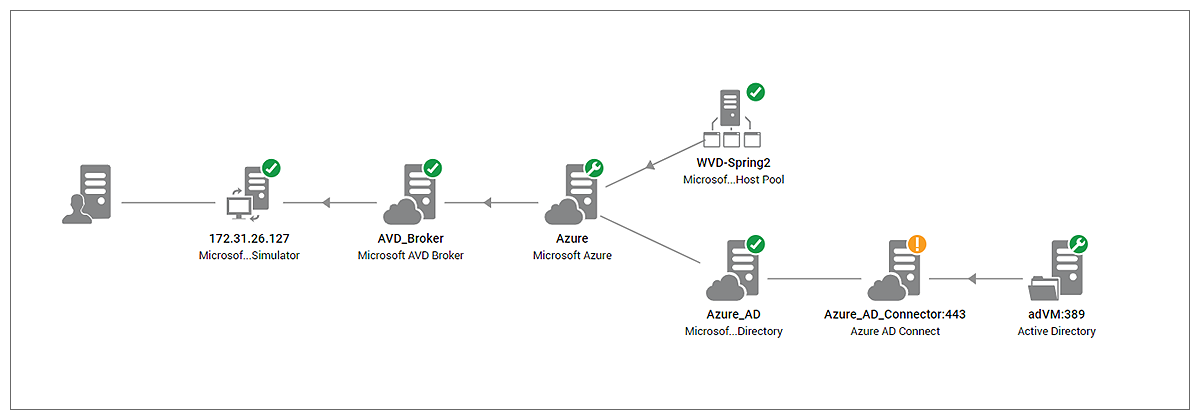
AVD in Azure architecture spans multiple connected layers: Azure services, authentication and identity, brokering, host pools, session hosts, network transport, user profiles, applications, and endpoints. Each layer influences the user experience, and a problem in one layer often appears as a symptom somewhere else.
That is why end-to-end visibility matters so much. eG Enterprise monitors the full AVD service delivery chain and extends visibility across desktops, endpoints, networks, storage, and other dependent tiers, helping IT teams troubleshoot virtual desktop performance with cross-tier context.
Why Enterprises Need AVD Monitoring
Enterprises adopt AVD for scalability, flexibility, and centralized workspace delivery, but those benefits only hold when the user experience remains consistent. If users face repeated login delays, disconnects, or application slowness, the business sees AVD as unreliable, no matter how elegant the architecture looks on paper.
Monitoring solves this by giving IT teams evidence, speed, and control. It helps operations teams detect problems earlier, helpdesks answer users faster, architects plan capacity more accurately, and leaders understand whether the workspace service is supporting productivity or limiting it.
Business Benefits
One of the main business benefits of AVD monitoring is reduced downtime and slowtime. Faster diagnosis means less finger-pointing and fewer long-running incidents. Another benefit is better infrastructure optimization, because historical analytics show whether the environment is under-sized, over-sized, or simply unevenly used.
eG Enterprise analytics help organizations optimize infrastructure to support more users and improve ROI. This makes monitoring strategic as well as defensive: it improves investment efficiency by revealing how the service is actually consumed over time.
User Experience
User experience is central to AVD success because users do not think in terms of host pools or Azure Storage. They care about how long it takes to log in, whether applications open quickly, whether input feels responsive, and whether sessions remain stable.
eG Enterprise tracks user experience metrics such as logon time, launch time, screen latency, input delay, frame rate, and bandwidth. These metrics give IT teams a direct view of what users actually feel, not just what infrastructure components report.
Common Azure Virtual Desktop Monitoring Challenges
AVD monitoring is difficult because the symptom and the root cause are often far apart. A complaint about slowness may originate in identity, profiles, network conditions, backend applications, or virtual machine resource exhaustion.
Login Delays
Login delays are one of the most common AVD challenges and one of the most visible to end users. They are also one of the hardest to diagnose without purpose-built monitoring because the delay may occur at multiple stages in the login journey.
Effective monitoring needs to be able to differentiate between problems with storage, the AVD broker, enumeration, FSLogix, authentication and so on.
That level of diagnostic specificity is important because a generic “login is slow” alert is not enough for operational teams that need to fix the problem quickly.
Session Reliability
Session reliability issues include disconnects, unstable sessions, intermittent failures, and machine registration problems. Users usually report these as “random” failures, but the patterns often become obvious when teams correlate session behavior with host health and network conditions.
Effective AVD monitoring must provide deep insights into the connection technologies used within Azure such as RDP Shortpath and STUN servers. Learn more: RDP Shortpath For Azure Virtual Desktop (AVD) | eG Innovations.
Monitoring needs to capture both the event and its surrounding context. Failed connections, session drops, active session counts, and user experience metrics together provide a far clearer picture than infrastructure uptime alone.
Network Issues
Network issues remain a major challenge because interactive desktop experience depends on consistent transport quality. Even when sessions remain connected, high latency or bandwidth instability can create lag, poor screen responsiveness, and reduced user productivity.
AVD monitoring must therefore include network-related data as part of the user experience view rather than treating it as a separate infrastructure silo. This is particularly important for distributed enterprises serving users across geographies and network conditions.
For organizations supporting remote or home workers, endpoint analytics that provide information on the final mile network (home Wi-Fi, ISP etc.) are essential.
Host Performance
Host performance issues are often amplified in shared AVD environments because one degraded host can affect many users. Teams need to know which session hosts are under pressure, whether load is balanced, and whether a user or application is consuming an unusual share of resources.
This is an area where historical reporting matters as much as real-time metrics. A host that repeatedly becomes saturated during the same time window each day or week may indicate a capacity planning issue rather than a one-off fault.
Learn more about troubleshooting AVD issues, see: Troubleshooting Azure Virtual Desktop (AVD) Issues through Logon and Beyond | eG Innovations.

Essential Azure Virtual Desktop Monitoring Metrics
The most effective AVD metric strategy combines service, infrastructure, and experience signals. Focusing too narrowly on one category creates blind spots.
Session Metrics
Key session metrics include active sessions, failed connections, disconnect frequency, session duration, active versus idle time, and logoff behavior. These help teams understand service demand, reliability, and how the environment is actually being used.
Session metrics are especially useful for operations and service management teams because they link directly to user impact. They also become more valuable when trended historically to identify demand changes and recurring instability.
Infrastructure Metrics
Infrastructure metrics should include details of the Azure services associated with the Azure subscription that hosts AVD such as compute, storage and networking. Resource metrics for Azure Virtual Machines should be captured to analyse bottlenecks and resource limitations. These metrics reveal whether the platform has enough healthy capacity to support the user base.
What matters most is correlation. AVD administrators do not just need to know that CPU is high. They need to know why it is high, which host is affected, which user or process is responsible, and whether the issue is affecting business-critical workloads.
Network Metrics
Bandwidth and session responsiveness indicators are important network metrics for AVD because the digital workspace experience depends heavily on transport quality. These metrics become critical during complaints about lag, drops, or frozen sessions.
When reviewed alongside login, protocol metrics and application performance, network metrics help determine whether the issue is environmental or workload-related. This narrows the investigation path and reduces wasted troubleshooting time.
User Experience Metrics
Logon time, application launch time, screen latency, input delay, and frame-related responsiveness are among the most important user experience metrics for AVD. These are the metrics that turn a technical monitoring platform into a service quality platform.
User experience metrics also help leadership teams because they translate technical conditions into business-relevant outcomes. Faster logins, smoother sessions, and fewer complaints are easier to communicate than raw infrastructure counters.
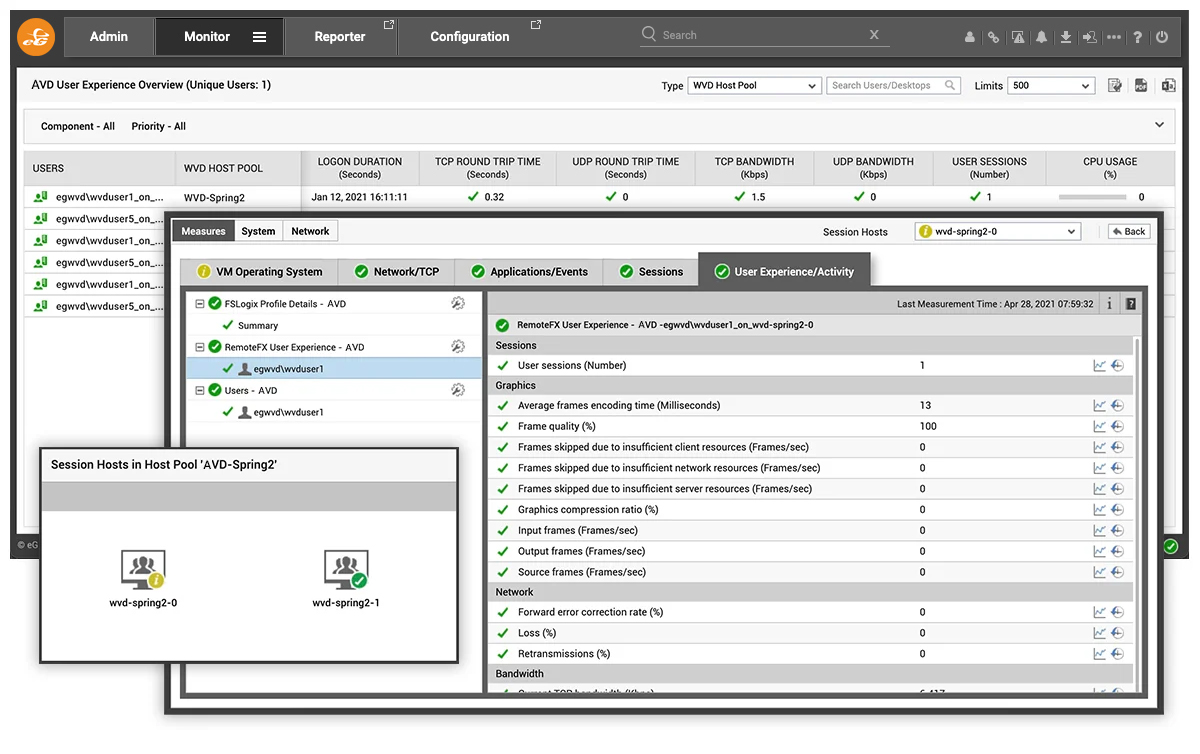
Learn more about key user experience metrics for AVD, see: Troubleshooting Azure Virtual Desktop (AVD) Sessions – Key User Experience and Graphics Metrics to Monitor | eG Innovations.
Native Azure Monitoring Tools
Microsoft offers native tools that can be part of an AVD monitoring strategy, but enterprises often need additional depth, simplicity, and AVD-specific guidance to support day-to-day operations effectively.
Azure Monitor
Azure Monitor can be used for AVD monitoring, and many organizations start there because it is part of the Azure ecosystem. For AVD operations, eG Enterprise reduces the effort required to build useful views by providing pre-defined dashboards, out-of-the-box alert thresholds, and role-ready reporting.
This matters because operations teams need ready answers, not just raw telemetry. If teams must invest significant time stitching metrics, logs, and views together before they can answer basic service questions, mean time to detection and mean time to resolution both suffer.
Log Analytics
Log Analytics can provide value when teams want flexible querying and log-based investigation. It is useful for deeper analysis and ad hoc exploration. However, it still depends on expertise, query design, and consistent operational interpretation to become a practical AVD monitoring workflow.
In other words, Log Analytics is capable, but not always convenient for every stakeholder. Helpdesk teams, operations teams, architects, and executives often need curated, role-specific views rather than a shared dependence on manual querying.
Azure Advisor
Azure Advisor contributes to optimization and recommendation workflows, particularly around resource use and cloud best practices. It can be helpful as part of a broader cloud governance strategy.
However, Advisor is not a substitute for direct session-level and user-experience-level monitoring. It supports optimization conversations, but enterprises still need monitoring that can answer real-time operational questions about digital workspace performance.
Enterprise AVD Monitoring Platforms
Enterprise AVD monitoring platforms are designed to reduce operational effort while increasing diagnostic depth. The strongest platforms combine user experience insight, cross-tier monitoring, alerting, historical analytics, and faster root-cause identification.
Comparison Table
| Capability | Native Azure approach | eG Enterprise |
| Ease of AVD operations setup | Dashboard setup can be tedious and time consuming for AVD monitoring. | Provides out-of-the-box alert thresholds, pre-defined dashboards, and pre-built reports. |
| User experience visibility | Requires teams to assemble relevant telemetry views. | Tracks logon time, launch time, screen latency, input delay, frame rate, and bandwidth. |
| Coverage scope | Platform-native telemetry across Azure services. | Monitors Azure account, Entra ID, host pools, session hosts, endpoints, and user sessions. |
| Monitoring style | Heavier dependence on manual dashboard and log workflows. | Combines synthetic and real user monitoring for proactive and live insight. |
| Root-cause support | Depends more on analyst correlation and custom views. | Uses alert thresholds, automatic baselining, and dependency-based correlation. |
| Cross-VDI coverage | Primarily Azure-centric. | Supports Citrix, Omnissa Horizon, Amazon WorkSpaces and Azure Virtual Desktop from a single pane of glass. |
How to Select the Right Azure Virtual Desktop Monitoring Solution
The right AVD monitoring solution should match the operational maturity and scale of the organization. At minimum, it should answer five questions quickly: Is the service available? Are users logging in successfully? Are sessions responsive? Where is the bottleneck? What trend is developing over time.?
Beyond those basics, selection criteria should include end-to-end visibility, user experience depth, pre-built operational content, historical reporting, support for capacity planning, and compatibility with other digital workspace platforms. This becomes especially important in enterprises that run AVD alongside Citrix, Omnissa Horizon, or Amazon WorkSpaces, because fragmented tooling creates fragmented accountability.
Organizations should also assess deployment flexibility. eG Enterprise supports SaaS, on-premises, and cloud deployment options, giving enterprises flexibility to align monitoring with their governance, security, and operations requirements. eG Enterprise also supports MSP workflows and multi-tenancy with per tenant and consolidated views that enable tenant self-service and similar operations.
Operational Roles in AVD Monitoring
One reason Azure Virtual Desktop monitoring is often harder than expected is that several teams depend on it for different purposes. Helpdesk teams need immediate user-centric answers. Operations teams need service health and alerting. Infrastructure teams need host and dependency insight. Architects need long-term trend data. Leadership teams need service-level and productivity-oriented reporting.
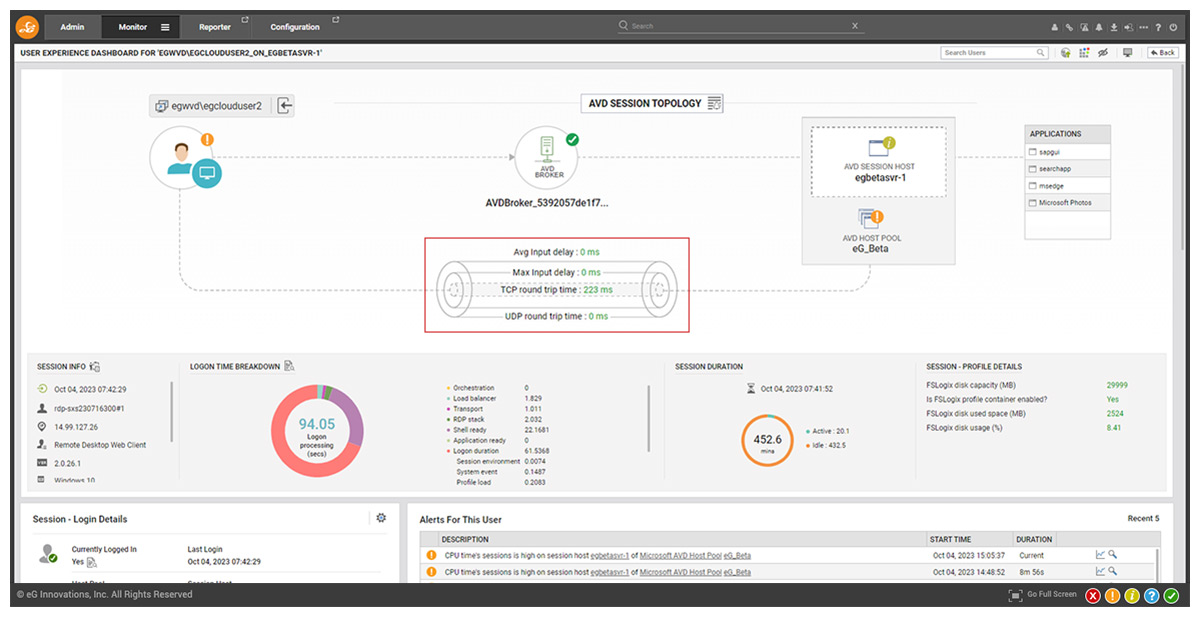
eG Enterprise supports these different stakeholder needs with purpose-built dashboards and reports for host utilization, user-specific bottlenecks, long-term optimization, and service-level visibility, instead of forcing every user into the same raw technical view. Role Based Access Control (RBAC) ensures each stakeholder is limited to their need-to-know area and avoids the need to grant access to Azure subscriptions.
Why Out-of-the-Box Context Matters
Enterprises often underestimate how much time is lost when monitoring tools require teams to build every AVD dashboard, set every alert threshold, and report manually. In theory, raw telemetry is enough. In practice, delays in creating useful views and meaningful alerts translate directly into delays in detecting and resolving performance issues.
That is why out-of-the-box AVD context matters. eG Enterprise provides pre-configured dashboards, pre-built reports, out-of-the-box alert thresholds, and user-experience views that shorten time to value and reduce the operational load on already busy teams.
How AVD Monitoring Improves Capacity Planning & ROI
Monitoring is often justified in terms of troubleshooting, but it also has direct strategic value for infrastructure planning. Historical reports help organizations understand whether the most appropriate Azure Virtual Machine instances type has been chosen, whether certain groups are consuming disproportionate resources, and whether workloads can be redistributed more efficiently.
These insights affect ROI because they influence how many users can be supported per host, when infrastructure must be expanded, and where overspending can be reduced. With eG Enterprise, historical reporting and analytics connect AVD performance data to infrastructure optimization and cost-efficiency decisions.
Best Practices for Azure Virtual Desktop Monitoring
- Monitor user experience and Azure infrastructure together so incidents are evaluated in business terms, not just technical terms.
- Use synthetic monitoring to validate service readiness before real users are affected.
- Review host utilization and session distribution regularly so overloaded hosts and imbalanced pools are caught early.
- Track active and idle time to support realistic capacity and cost decisions.
- Standardize dashboards and reports for different stakeholders so helpdesk, operations, architects, and leadership all get useful insight.
- Use historical reporting for optimization, compliance, and ROI analysis rather than relying only on real-time views.
Conclusion
Azure Virtual Desktop monitoring has to do more than surface metrics. It has to help enterprises maintain user experience, improve service reliability, and make better capacity and cost decisions. That requires visibility across the full AVD delivery path and enough operational context to move from symptom to cause quickly.
The best monitoring solutions for AVD are the ones that treat the service as a digital workspace, not merely a collection of cloud resources. When monitoring spans user experience, host performance, session behavior, and long-term analytics, IT teams are in a much stronger position to scale AVD with confidence.
Next Steps
Learn more about eG Enterprise’s capabilities for monitoring AVD, see: Azure Virtual Desktop Monitoring Tool for AVD Performance.
eG Enterprise is an Observability solution for Modern IT. Monitor digital workspaces,
web applications, SaaS services, cloud and containers from a single pane of glass.
Frequently Asked Questions
Azure Virtual Desktop monitoring tracks availability, performance, usage, and user experience across Azure services, Entra ID, host pools, session hosts, and user sessions. It helps IT teams identify bottlenecks, maintain service reliability, and deliver consistent digital workspace performance. Effective monitoring also connects infrastructure health with what users actually experience during logins, application launches, and active sessions.
The best AVD monitoring tool offers end-to-end visibility, user experience metrics, historical analytics, proactive alerting, and fast root-cause diagnosis. eG Enterprise correlates metrics across the full AVD service chain, helping IT teams troubleshoot issues quickly from one unified platform. It also gives different stakeholders practical dashboards instead of forcing every team to build views manually.
Improve AVD performance by monitoring logon time, screen latency, session density, host utilization, network responsiveness, and application behavior. Use these insights to right-size VM resources, balance sessions, optimize profiles, and resolve network or backend bottlenecks before users are affected. Historical trends also help identify recurring capacity issues and prevent repeated performance complaints.
Important AVD KPIs include logon time, failed connections, active sessions, idle versus active usage, application launch time, session duration, host utilization, screen latency, and bandwidth consumption. Together, they show service health, user productivity, reliability, and infrastructure efficiency. Tracking these KPIs over time helps teams spot recurring bottlenecks and plan capacity more accurately.
Azure Monitor supports AVD monitoring, but teams may need custom dashboards, configuration, queries, and log analysis to get actionable insights. It is useful for native Azure telemetry, but it may not answer every operational question out of the box. Purpose-built tools like eG Enterprise add prebuilt dashboards, correlated metrics, and built-in intelligence for faster troubleshooting.
Monitor AVD user experience with logon duration, application launch time, screen latency, input delay, frame rate, bandwidth usage, and session responsiveness. Combining real user monitoring with synthetic testing shows how users actually experience the service before, during, and after login. This helps IT teams distinguish infrastructure health from the quality of the delivered desktop experience.
Session disconnects typically result from network instability, overloaded session hosts, authentication issues, profile problems, endpoint conditions, or failures in dependent services. Identifying the root cause requires cross-layer visibility into network performance, host health, user sessions, and Azure service dependencies. Without that context, teams may treat the symptom while the real issue continues to affect users.
Enterprises monitor large AVD environments using centralized dashboards, proactive alerting, real and synthetic user monitoring, historical trend analysis, and cross-tier diagnostics. Advanced tools correlate data across identity, infrastructure, sessions, applications, endpoints, and network layers. This makes monitoring scalable, reduces troubleshooting time, and helps distributed IT teams maintain consistent performance across large or geographically spread deployments.