



What is Garbage Collection in Java?
 What is Garbage Collection in Java?. In Java applications, objects are stored in a memory area called the “heap”, which is dedicated to dynamically allocated objects. If left unattended, these objects can accumulate and deplete the available memory in the heap – eventually leading to an OutOfMemoryError.
The Java Virtual Machine (JVM) employs an automatic Garbage Collection (GC) mechanism. This mechanism handles the release of memory occupied by unused objects and reallocates that memory space for new objects.
Common Misunderstanding: Garbage Collection in Java is the automated process of “deleting code“
Garbage collection in Java is the automated process of reclaiming memory occupied by unused objects, not deleting code.
Get in-depth information on Java Garbage Collection: automated memory management, heap memory, mark-and-sweep algorithm, JVM generations, garbage collectors and more.
The Garbage Collection (GC) feature in the Java Virtual Machine (JVM) is truly remarkable. It automatically identifies and cleans up unused Java objects without burdening developers with manual allocation and deallocation of memory.
As an SRE or Java Administrator you need a strong understanding of the Java Garbage Collection mechanism to ensure optimal performance and stability of your Java applications. If you are looking for a basic general overview on the principles of “What is Garbage Collection in Programming?” – you may like to start, here: What is garbage collection (GC) in programming? (techtarget.com).
Common Java Garbage Collection Challenges
The complex nature of the GC and and its myriad options can often cause performance issues affecting end user experience due to poor GC tuning:
- Application Pauses: During GC cycles, the application may experience pauses causing the application to hang or lag.
 Application Crashes: GC may fail to reclaim sufficient memory. This can cause OutOfMemory errors, leading to application crashes.
- High CPU Usage: GC can consume a significant amount of CPU resources, impacting application performance. Answering the question: “Is it the application code or the JVM GC?” can be challenging.
- Memory Fragmentation: Repeated allocation and deallocation of memory can result in memory fragmentation, slowing down allocation speed and leading to allocation errors.
An application monitoring tool can detect GC issues and answer the following questions using historical and real-time data:
- Is garbage collection taking too long and adversely affecting Java application performance?
- How does performance compare across different garbage collection settings?
- Are JVM restarts occurring unexpectedly?

In this educational post, we will explain what Java Garbage Collection is, why it is important, and how to make it easy for Java SREs and administrators to deal with it. In related posts, we will look at how to get detailed visibility into your Java memory and GC Java performance.
Why is Garbage Collection Important in Java?
Java Garbage Collection is essential for several reasons:
- Automation and simplification: Automatic garbage collection in Java takes the burden off developers. In contrast, languages like C or C++ require explicit memory allocation and deallocation, which can be error-prone and lead to crashes if not handled properly.
- Increased Developer Productivity: With automatic Java memory management, developers can focus on writing application logic, leading to faster development cycles.
- Preventing OutOfMemoryError: By automatically tracking and removing unused objects, garbage collection prevents memory-related errors like OutOfMemoryError errors.
- Eliminates dangling pointer bugs: These are bugs that occur when a piece of memory is freed while there are still pointers to it, and one of those pointers is dereferenced. By then the memory may have been reassigned to another use with unpredictable results.
- Eliminates Double free bugs: These happen when the program tries to free a region of memory that has already been freed and perhaps already been allocated again.
Limitations of Java Garbage Collection
- GC can still impact performance: In spite of its benefits, GC can still impact application speed. As an SRE, you need to select the appropriate garbage collector relative to your application workloads.
- GC cannot prevent memory leaks: A memory leak in Java is a situation where unreferenced objects persist in memory, preventing the garbage collector from reclaiming them. This can lead to application slowdowns or crashes.
Application Monitoring: Use application monitoring tools to detect and address performance issues promptly. This proactive approach ensures smooth and efficient Java applications.

Java Heap Memory Generations Explained
Understanding the memory heap generations is crucial for Java garbage collection efficiency. The generations are:
- Eden: Where objects are created; GC removes unused objects or moves them to Survivor space if still referenced.
- Survivor: Comprises survivor zero and survivor one spaces in the young generation.
- Tenured: Holds long-lived objects; GC checks this less frequently due to its larger size in the old generation.
Garbage collection occurs more often in Eden, while Tenured is checked less, optimizing the process. Minor garbage collection takes place in the young generation, while major garbage collection occurs in the old generation and takes longer but happens less frequently. The permanent generation (PermGen) was removed in Java 8.
How Does Java Garbage Collection Work?
In Java, objects are created dynamically using the “new” keyword. Once an object is created, it occupies memory space on the heap. As a program executes, objects that are no longer referenced or accessible need to be removed to free up memory and prevent memory leaks. Thus, the Java heap memory contains a collection of live and dead objects – live objects are still in use and dead objects are no longer needed.
The Garbage Collection in Java operation is based on the premise that most objects used in the Java code are short-lived and can be reclaimed shortly after their creation. As a result of garbage collection in Java, unreferenced objects are automatically removed from the heap memory, which makes Java memory-efficient.
In general, all Java garbage collectors have two main objectives:
- Identify all objects that are still in use or “alive.”.
- Remove all other objects that are considered dead or unused (i.e., unreachable).
The Java garbage collector performs this task by periodically identifying and reclaiming memory that is no longer in use. The most commonly used Java Garbage Collection algorithm is called the mark-and-sweep algorithm, which follows these steps:
- Marking phase: The garbage collector starts with a root set of objects (e.g., global variables, stack frames, and CPU registers) that are known to be in use. It recursively traverses through these objects, marking each object it encounters as “live” or reachable. All reachable objects starting from known root references (such as local variables, static variables, and thread stacks) are marked as live objects.
- Sweeping phase: The garbage collector scans the entire heap, identifying and reclaiming memory occupied by objects that were not marked during the marking phase. These objects are considered garbage. Any objects that have not been marked as “live” during the mark phase are considered unreachable and are marked as eligible for garbage collection. The memory occupied by these unreachable objects is then freed up for future allocations.
When is an Object Eligible for Garbage Collection in Java?
- Every Java program has one or more threads. An object is eligible for garbage collection when no live thread can access it.
- If two objects have reference to each other and do not have any live reference then both objects are candidates for being garbage collected.
- If a reference of an object is explicitly set to null, the object is available for garbage collection.
- An object also becomes eligible for garbage collection if it is created inside a block and the reference goes out of the scope once control of the program exits from this block.
Objects that are actively referenced by live threads are not eligible for garbage collection.
Two types of garbage collection activity that usually happen in Java
- A minor or incremental Java garbage collection is said to have occurred when unreachable objects in the young generation heap memory are removed.
- A major or full Java garbage collection is said to have occurred when the objects that survived the minor garbage collection and were then copied into the old generation or permanent generation heap memory are removed. When compared to young generation, garbage collection happens less frequently in old generation.
To free up memory, the JVM must stop the application from running for at least a short time and execute the GC process. This process is called “stop-the-world.” This means all the threads, except for the GC threads, will stop executing until the GC threads are executed and objects are freed up by the garbage collector.
Modern Java GC implementations try to minimize blocking “stop-the-world” stalls by doing as much work as possible in the background (i.e. using a separate thread), for example marking unreachable garbage instances while the application process continues to run.
How Garbage Collection Affects Java Performance
Garbage collection in the JVM consumes CPU resources when deciding which memory to free. Stopping the program or consuming high levels of CPU resources will have a negative impact on the end-user experience with users complaining that the application is slow. Various Java garbage collectors have been developed over time to reduce the application pauses that occur during garbage collection and at the same time to improve on the performance hit associated with garbage collection.
Modern JVMs have multiple collectors (alternative garbage collection algorithms) for performing the GC activity:

- Serial Garbage Collector: Single-threaded GC execution. Enable with -XX:+UseSerialGC.
- Parallel Garbage Collector: Multiple minor threads executing GC in parallel. Enable with -XX:+UseParallelGC.
- Concurrent Mark Sweep (CMS): Concurrent execution of some application threads with reduced stop-the-world GC frequency. Enable with -XX:+UseConcMarkSweepGC. However, note that CMS was deprecated in JDK 9.
- G1 Garbage Collector: Designed for big workloads, concurrent, minimizes pauses, adapts to machine conditions, string de-duplication feature reduces the overhead of strings. You can explicitly enable it using the JVM option -XX:+UseG1GC.
- Epsilon Garbage Collector: Do-nothing GC for ultra-latency-sensitive or garbage-free applications. Use the following flags: -XX:+UnlockExperimentalVMOptions and -XX:+UseEpsilonGC
- Shenandoah Garbage Collector: Concurrent GC with compaction and memory release while the application is running. Use the following flags: -XX:+UseShenandoahGC -XX:+UnlockExperimentalVMOptions -XX:ShenandoahGCMode=generational
- ZGC (Z Garbage Collector): Experimental initially, designed for large heaps, concurrent, low pause times (<10ms), supports small to massive heap sizes. ZGC can be enabled using the -XX:+UseZGC JVM option.
Many JVMs, such as Oracle HotSpot, JRockit, OpenJDK, IBM J9, and SAP JVM, use stop-the-world GC techniques – however, recent collectors such as G1GC and ZGC are changing this situation. Modern JVMs like Azul Platform Prime (formerly Zing) use Continuously Concurrent Compacting Collector (C4), which eliminates the stop-the-world GC pauses that limit scalability in the case of conventional JVMs.
Why is Monitoring Java Garbage Collection Important?
Garbage collection can impact the performance of Java applications in unpredictable ways. When there is frequent GC activity, it adds a lot of CPU load and slows down application processing. In turn, this leads to slow execution of business transactions and ultimately affects the user experience of end-users accessing the Java application.
Excessive garbage collection activity can occur due to a memory leak in the Java application. Insufficient memory allocation to the JVM can also result in increased garbage collection activity. And when excessive garbage collection activity happens, it often manifests as increased CPU usage of the JVM!
For optimal Java application performance, it is critical to monitor a JVM’s GC activity. For good performance, full GCs should be few and far between. The time spent on GC should be low – typically less than 5% and the percentage of CPU spent for garbage collection should also be very low (this allows application threads to use almost all the available CPU resources).
Key Java Garbage Collection Metrics to Monitor
To know if garbage collection is creating Java performance problems, you need to track all aspects of the garbage collection activity in the JVM:
- When garbage collection happened
- How often garbage collection is happening in the JVM
- How much memory is being collected each time
- How long garbage collection is running for in the JVM
- Percentage of time spent by JVM for garbage collection
- What type of garbage collection happened – minor or full GC?
- JVM heap and non-heap memory usage
- CPU utilization of the JVM
This allows you to identify when Java garbage collection is taking too long and impacting performance, which will help you to determine the optimal settings for each application based on historical patterns and trends.
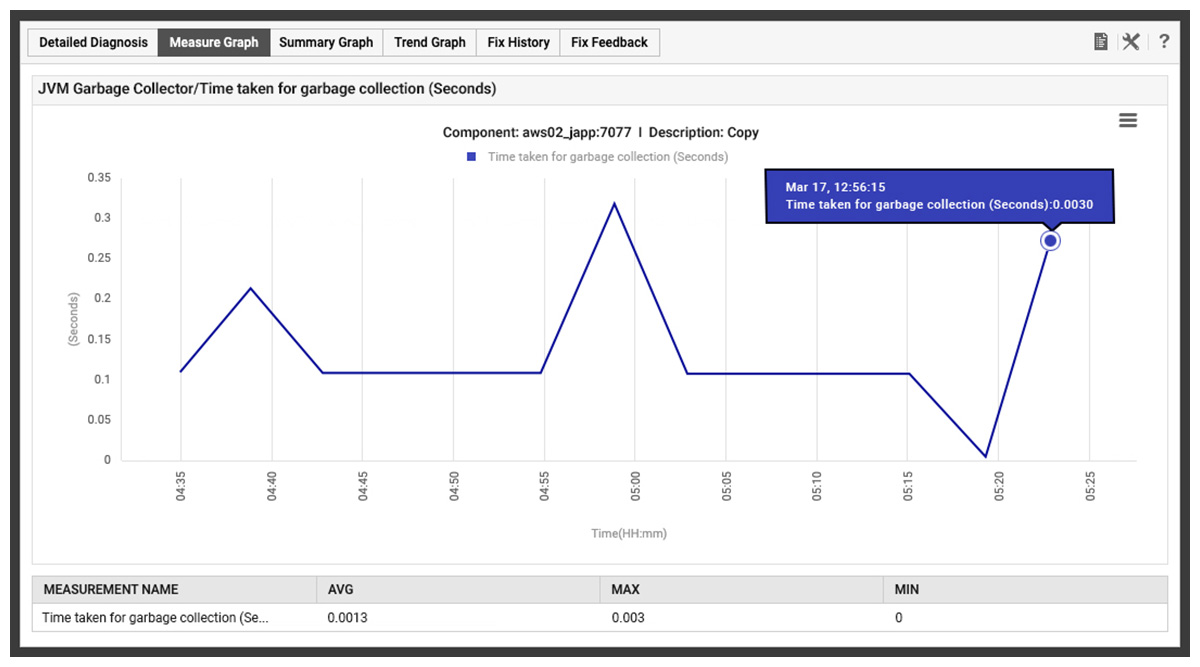
Troubleshooting Java Garbage Collection Problems
One way to troubleshoot whether the Java garbage collection process is impacting the performance of your application, when Java GC activity is excessive, is to take heap dumps of the JVM’s memory and analyze the top memory consuming objects. Any unusually large objects are an indicator of memory leaks in the application code.
On the other hand, if no object is occupying an unusually large amount of memory and if the percentage of memory used by any of the JVM’s memory pools is close to 100%, this is an indicator that the JVM’s memory configuration may be insufficient. In this case, you may need to increase the corresponding JVM memory pool for improved application performance.

Best Practices for Java Garbage Collection
Now that we have fair understanding of Java garbage collection, let’s summarize by answering some of key questions SREs and Java admins may have:
- Is garbage collection in Java good or bad? Definitely good. But, as the adage goes, too much of anything is a bad thing. So, you need to make sure Java heap memory is properly configured and managed so that the GC activity is optimized.
- When is Java GC needed? It is needed when there are unreferenced objects to be cleared out. Since it is not a manual activity, the JVM will automatically take care of this for you. From all the information above, you would have learned why GC is needed and when.
- How to tune Java garbage collection? There are two common ways to do this:
- Keep the number of objects passed to the old generation area to a minimum
- Configure the major (or full) GC time to be low
- Some critical JVM parameters to configure for right-sizing the JVM’s memory are -Xms, -Xmx, and -NewRatio (ratio of new generation and old generation size)
- How to know when Java GC is not operating as expected? JVM monitoring is key. Make sure to track vital JVM metrics and be alerted when GC activity is deviating from the norm.
eG Enterprise is an Observability solution for Modern IT. Monitor digital workspaces,
web applications, SaaS services, cloud and containers from a single pane of glass.
Monitor Java Garbage Collection with eG Enterprise
With eG Enterprise, you can optimize JVM and Java application performance:
- Set up monitoring quickly with prebuilt Java dashboards.
- Visualize metrics like garbage collection CPU time, CPU utilization, memory heap usage, and more.
- Identify and triage issues, detect memory leaks and performance bottlenecks.
- Fine-tune memory heap and garbage collector configurations for optimal performance.
- Leverage prebuilt alerts for high CPU usage, memory, transaction errors, and Apdex score.
- Notify teams via Slack and PagerDuty for prompt issue resolution.
eG Enterprise is an Observability solution for Modern IT. Monitor digital workspaces,
web applications, SaaS services, cloud and containers from a single pane of glass.
Frequently Asked Questions
Garbage collection (GC) in Java is an automatic memory management process that identifies and removes objects that are no longer being used by an application. Instead of requiring developers to manually allocate and free memory, the Java Virtual Machine (JVM) automatically reclaims memory occupied by unreachable objects. This helps prevent common programming issues such as memory leaks, dangling pointers, and manual memory management errors. Garbage collection simplifies application development, improves code reliability, and allows developers to focus more on business logic rather than memory cleanup tasks.
Java garbage collection works by identifying objects that are no longer reachable from active parts of an application, such as local variables, static variables, and active threads. The JVM periodically scans memory to determine which objects are still in use and which can be safely removed. Most Java garbage collectors follow a generational approach, where newly created objects are placed in a young generation and long-lived objects are promoted to an older generation. By reclaiming memory from unused objects automatically, garbage collection helps maintain application stability and efficient memory utilization while minimizing the risk of memory-related errors.
Garbage collection is important because it automates memory management and reduces the burden on developers. Without garbage collection, applications would require manual memory allocation and deallocation, increasing the likelihood of programming mistakes and memory errors. Garbage collection helps ensure that unused objects do not unnecessarily consume memory, improving application performance and reliability. It also reduces the risk of memory leaks and application crashes caused by exhausted memory resources. By automating these tasks, Java enables developers to build scalable and maintainable applications more efficiently while enhancing overall system stability.
Java provides several garbage collectors designed for different workload requirements and performance goals. Serial GC is suitable for smaller applications and single-threaded environments. Parallel GC focuses on maximizing throughput by using multiple threads during garbage collection. G1 Garbage Collector (G1GC) is designed for large heap sizes and balanced performance. Z Garbage Collector (ZGC) prioritizes extremely low pause times for large-scale applications. Shenandoah GC is another low-latency collector that aims to minimize application interruptions. Each garbage collector offers different trade-offs between throughput, latency, resource utilization, and scalability, allowing organizations to choose the most appropriate option for their workloads.
Minor GC and Full GC differ in the areas of memory they target and their impact on application performance. Minor GC focuses on cleaning the young generation, where newly created objects are stored. Since most objects become obsolete quickly, Minor GC events are generally fast and occur frequently. Full GC, on the other hand, scans and cleans the entire heap, including both young and old generations. Full GC operations are typically more resource-intensive and can cause longer application pauses. Frequent Full GC events may indicate memory pressure, inefficient object allocation patterns, or potential memory management issues that require investigation.
The Garbage-First Garbage Collector (G1GC) is a server-oriented garbage collector designed to deliver predictable pause times while efficiently managing large heap sizes. Instead of dividing memory into fixed contiguous generations, G1GC organizes the heap into multiple regions and prioritizes cleaning areas that contain the most reclaimable memory. This approach allows G1GC to balance application throughput and latency more effectively than many traditional collectors. It is commonly used in enterprise applications because it can scale well across large systems while helping reduce long garbage collection pauses that impact application responsiveness.
ZGC is typically a better choice when your primary requirement is achieving extremely low latency with minimal garbage collection pauses, even when working with very large heap sizes. It is designed to keep pause times consistently low, often measured in milliseconds regardless of heap size. G1GC, however, offers a balanced approach that works well for many enterprise applications where both throughput and latency are important. Organizations should consider ZGC when running large-scale, latency-sensitive workloads such as real-time analytics, financial systems, online transaction processing platforms, or highly interactive services where even short pauses can affect user experience.
Improving Java garbage collection performance involves optimizing both application design and JVM configuration. Developers can reduce excessive object creation, reuse objects where appropriate, and select efficient data structures to minimize memory pressure. Monitoring heap utilization and tuning heap sizes can help avoid unnecessary garbage collection cycles. Choosing the most suitable garbage collector for the workload is also important, as different collectors prioritize throughput, latency, or scalability. Regular performance profiling and garbage collection log analysis can help identify bottlenecks, enabling organizations to fine-tune JVM settings and maintain optimal application performance.
Frequent garbage collection usually occurs when applications create large numbers of temporary objects or when available heap memory is insufficient for workload demands. Poor coding practices, excessive object allocation, memory-intensive processing, and inefficient caching mechanisms can all increase garbage collection activity. In some cases, incorrectly configured heap sizes force the JVM to perform garbage collection more often than necessary. Applications with high transaction volumes or rapidly changing workloads may also experience increased GC frequency. Regular monitoring and analysis of memory usage patterns can help identify the root causes and reduce unnecessary garbage collection overhead.
Detecting memory leaks in Java typically involves monitoring heap usage and analyzing application behavior over time. A memory leak occurs when objects remain referenced and cannot be garbage collected, even though they are no longer needed. Developers can identify leaks using heap dumps, memory profilers, and JVM monitoring tools that track object allocation and retention patterns. Common indicators include steadily increasing memory consumption, frequent Full GC events, growing heap utilization after garbage collection, and eventual OutOfMemoryError exceptions. By examining retained objects and reference chains, teams can locate the source of leaks and implement corrective measures to improve memory efficiency.


