VIO Volume Groups Test
A physical volume is a collection of regions on one or more disks. Data is stored in physical volumes and administrative operations are performed on physical volumes. A volume group is a collection of one or more physical volumes of varying sizes and types. A physical volume can belong to only one volume group per system; there can be up to 4096 active volume groups on a Virtual I/O Server.
To know the state, composition, and usage of each volume group configured on a Virtual I/O server, use this test.
Target of the test : An IBM pSeries server
Agent deploying the test : A remote agent
Outputs of the test : One set of results for each volume group configured on the VIO server on the IBM pSeries server being monitored.
| Parameter | Description |
|---|---|
|
Test period |
How often should the test be executed |
|
Host |
The IP address of the host for which this test is to be configured. |
|
Port |
Indicate the port at which the specified Host listens. By default, this is NULL. |
|
Real ServerName |
Specify the name of the pSeries server in the Real ServerName text box. If the target pSeries server has been auto-discovered using HMC, the server name will be set automatically in the Real ServerName text box. However, while configuring this test for a pSeries server that has been manually added, you have to explicitly provide the server name in the Real ServerName text box. Note: To obtain the real server name, a user can login to the target pSeries server as a valid pSeries user, go to the shell prompt of the server, and execute the following command: lssyscfg - r sys -F name |
|
Is Managed By |
By selecting an option from the Is Managed By list, indicate whether the target pSeries server is managed using an HMC server or an IVM (Integrated Virtual Manager) server. If the target server has been auto-discovered via an HMC server, the HMC option will be automatically chosen from this list. |
|
Management Server, Management User, Management Password |
This test connects to an HMC/IVM server to perform LPAR discovery and to collect host-level and "outside view" metrics from the pSeries server. To enable this communication, first, provide the IP address/host name of the HMC/IVM server in the Management Server text box. If the eG manager had automatically discovered the target pSeries server by connecting to an HMC server in the environment, then, the IP address/host name and user credentials pertaining to that HMC server will be automatically displayed in the Management Server, Management User, and Management Password text boxes. However, if the pSeries server being monitored was manually added to the eG Enterprise system (and not auto-discovered via the HMC server), then, you will have to explicitly indicate whether the target pSeries server is managed by an HMC server or an IVM server by selecting an option from the Is Managed By list. If the HMC option is chosen, then, you will have to provide the IP address of the HMC server that manages the target pSeries server in the Management Server text box. In such a case, in the Management User and Management Password text boxes, you will have to provide the credentials of an HMC user who is assigned the hmcviewer role. On the other hand, if the IVM option is chosen from the Is Managed By list, it implies that the IP address/host name and user credentials pertaining to that IVM server has to be explicitly provided in the Management Server, Management User, and Management Password text boxes. |
|
Confirm Password |
Confirm the HMC Password by retyping it here |
|
Domain |
Set the Domain parameter to none. |
|
Admin User, Admin Password, Confirm Password |
The eG agent remotely communicates with each discovered LPAR on the pSeries server to obtain their "inside view". For this, the eG agent will have to be configured with the credentials of a valid user with access rights to each LPAR. If a single user is authorized to access all the LPARs on the pSeries server, provide the name and password of the user in the Admin User and Admin Password text boxes, and confirm the password by retyping it in the Confirm Password text box. On the other hand, if the test needs to communicate with different LPARs using different user accounts, then, multiple user names and passwords will have to be provided. To help administrators provide these multiple user details quickly and easily, the eG administrative interface embeds a special configuration page. To know how to use this page, refer to Configuring Users for LPAR Monitoring. |
|
SSL |
By default, the HMC/IVM server (as the case may be) is not SSL-enabled. This indicates that by default, the eG agent communicates with the HMC/IVM server using HTTP. Accordingly, the SSL flag is set to No by default. If you configure the HMC/IVM server to use SSL, then make sure that the SSL flag is set to Yes, so that the eG agent communicates with the HMC/IVM server using HTTPS. |
|
Ignore VMs Inside View |
Administrators of some high security LPAR environments might not have permissions to internally monitor one/more LPARs. The eG agent can be configured to not obtain the 'inside view' of such ‘inaccessible’ VMs using the Ignore VMs Inside View parameter. Against this parameter, you can provide a comma-separated list of LPAR names, or LPAR name patterns, for which the inside view need not be obtained. For instance, your Ignore VMs Inside View specification can be: *lp,aixlp*,lin*. Here, the * (asterisk) is used to denote leading and trailing spaces (as the case may be). By default, this parameter is set to none indicating that the eG agent obtains the inside view of all LPARs on a pSeries server by default. Note: While performing LPAR discovery, the eG agent will not discover the operating system of the LPARs configured in the Ignore VMs Inside View text box. |
|
Exclude VMs |
Administrators of some virtualized environments may not want to monitor some of their less-critical LPARs both from 'outside' and from 'inside'. The eG agent in this case can be configured to completely exclude such LPARs from its monitoring purview. To achieve this, provide a comma-separated list of LPARs to be excluded from monitoring in the Exclude VMs text box. Instead of LPARs, LPAR name patterns can also be provided here in a comma-separated list. For example, your Exclude VMs pecification can be: *lp,aixlp*,lin*. Here, the * (asterisk) is used to denote leading and trailing spaces (as the case may be). By default, this parameter is set to none indicating that the eG agent obtains the inside and outside views of all AIX LPARs on a virtual host by default. By providing a comma-separated list of LPARs/LPAR name patterns in the Exclude VMs text box, you can make sure the eG agent stops collecting 'inside' and 'outside' view metrics for a configured set of LPARs. |
|
Detailed Diagnosis |
To make diagnosis more efficient and accurate, the eG Enterprise embeds an optional detailed diagnostic capability. With this capability, the eG agents can be configured to run detailed, more elaborate tests as and when specific problems are detected. To enable the detailed diagnosis capability of this test for a particular server, choose the On option. To disable the capability, click on the Off option. The option to selectively enable/disable the detailed diagnosis capability will be available only if the following conditions are fulfilled:
|
| Measurement | Description | Measurement Unit | Interpretation |
|---|---|---|---|
|
Volume group status |
Indicates the current state of this volume group. |
Percent |
If this measure reports the value 100, it indicates that this volume group is active/complete. Such a state implies that all physical volumes within the group are currently active. On the other hand, if this measure reports the value 0, it indicates that this volume group is active/partial. This state implies that some physical volumes in the group are currently inactive. |
|
Maximum logical volumes |
Indicates the maximum number of logical volumes allowed in this volume group. |
Number |
A logical volume presents the user with a contiguous address space of pages (0 .. N-1 pages in a volume with N pages) on secondary storage. Page I/O, mounting, and dismounting volumes is performed by applications on logical volumes. A logical volume is mapped to one or more physical volumes. All user I/O occurs through a logical volume. |
|
Currently available logical volumes |
Indicates the number of logical volumes currently in this volume group. |
Number |
The detailed diagnosis of this measure lists the logical volumes within the group, the current state of the volume, and the number of logical partitions, physical partitions, and physical volumes attached to this volume group. |
|
Currently opened logical volumes |
Indicates the number of logical volumes within this volume group that are currently open. |
Number |
|
|
Total physical volumes |
Indicates the total number of physical volumes within this volume group. |
Number |
To know which physical volumes are within this group, use the detailed diagnosis of this measure. The detailed diagnosis will list the physical volumes in the group, the state of each volume, the number of physical partitions within every volume, and the number of free partitions per volume. |
|
Stale physical volumes |
Indicates the total number of stale physical volumes within this volume group. |
Number |
A physical volume is stale if its contents reflect a version of the logical volume that is earlier than the current version. Typically, if a user mounts a logical volume while one of two physical volumes backing it is unavailable, but immediately dismounts it, the unavailable physical volume is declared as stale. |
|
Currently active physical volumes |
Indicates the number of physical volumes that are currently active in this volume group. |
Number |
|
|
Maximum physical partitions per volume group |
Indicates the maximum number of physical partitions allowed for this volume group. |
Number |
|
|
Maximum physical partitions per physical volume |
Indicates the maximum number of physical partitions per physical volume allowed for this volume group. |
Number |
|
|
Size of each physical partition |
Indicates the size of each physical partition supported by each physical volume in this volume group. |
MB |
When you add a physical volume to a volume group, the physical volume is partitioned into contiguous, equal-sized units of space called physical partitions. A physical partition is the smallest unit of storage space allocation and is a contiguous space on a physical volume. Physical volumes inherit the volume group’s physical partitions size. |
|
Total physical partitions |
Indicates the total number of physical partitions within this volume group. |
Number |
|
|
Not allocated physical partitions |
Indicates the number of physical partitions in this volume group that are not allocated to logical volumes. |
Number |
|
|
Allocated physical partitions |
Indicates the number of physical partitions in this volume group that are currently allocated to logical volumes. |
Number |
|
|
Stale physical partitions |
Indicates the number of stale physical partitions currently available in the logical volumes supported by this volume group. |
Number |
A STALE physical partition is a physical partition that contains data you cannot use. Physical partitions marked as STALE must be updated to contain the same information as valid physical partitions. This process, called resynchronization, can be done at vary-on time, or can be started anytime the system is running. Until the STALE partitions have been rewritten with valid data, they are not used to satisfy read requests, nor are they written to on write requests. |
|
Maximum physical volumes |
Indicates the maximum number of physical volumes allowed in this volume group. |
Number |
|
The detailed diagnosis of the Currently available logical volumes measure lists the logical volumes within the group, the current state of the volume, and the number of logical partitions, physical partitions, and physical volumes attached to this volume group.
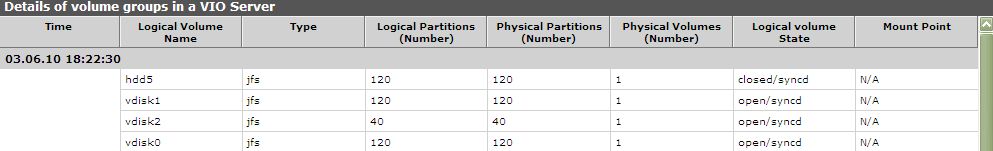
Figure 1 : The detailed diagnosis of the Currently available logical volumes measure
The detailed diagnosis of the Total physical volumes measure will list the volumes in the group, the state of each volume, the number of physical partitions within every volume, and the number of free partitions per volume.

Figure 2 : The detailed diagnosis of the Total physical volumes measure