DDC Farm Test
For every farm configured on a main delivery controller component, this test reports key statistics such as the number of DDCs managed by the farm and the number of desktop groups configured on each DDC.
Note:
This test will report all measures only if the server being monitored is the farm server – i.e., is the master server in the farm. If not, only the Is license server available measure will be reported.
Target of the test : A Citrix Delivery Controller v3/4
Agent deploying the test : An internal agent
Outputs of the test : One set of results for farm configured on the main desktop delivery controller.
| Parameter | Description |
|---|---|
|
Test Period |
How often should the test be executed. |
|
Host |
The IP address of the host for which this test is to be configured. |
|
Port |
Refers to the port at which the specified host listens to. The default port number is 80. |
|
Detailed Diagnosis |
To make diagnosis more efficient and accurate, the eG Enterprise embeds an optional detailed diagnostic capability. With this capability, the eG agents can be configured to run detailed, more elaborate tests as and when specific problems are detected. To enable the detailed diagnosis capability of this test for a particular server, choose the On option. To disable the capability, click on the Off option. The option to selectively enable/disable the detailed diagnosis capability will be available only if the following conditions are fulfilled:
|
| Measurement | Description | Measurement Unit | Interpretation |
|---|---|---|---|
|
Is license server available? |
Indicates whether the license server is currently available or not. |
Boolean |
While the value 1 indicates that the license server is available, the value 0 indicates that it is not. The non-availability of the license server could have serious repercussions on the operations of the DDC, and can cause significant delays or can even completely stall the delivery of the XenDesktop solution. |
|
Total desktop controllers |
Indicates the number of DDCs managed by this farm. |
Number |
To know the details of the individual DDCs managed by the farm, use the detailed diagnosis of this measure. |
|
Total desktop groups |
Indicates the number of desktop groups configured on this farm. |
Number |
To know the details of the desktop groups, use the detailed diagnosis of this measure. |
|
Available desktop groups |
Indicates the number of desktop groups that are currently available. |
Number |
To know the details of the desktop groups that are available, use the detailed diagnosis of this measure. |
|
Unavailable desktop groups |
Indicates the number of desktop groups that are currently unavailable. |
Number |
If a desktop group is disabled, it will be unavailable for use by the DDC. To know the details of the unavailable desktop groups, use the detailed diagnosis of this measure. |
The detailed diagnosis of the Total desktop controllers measure reveals the name and IP address of the controllers managed by a farm.
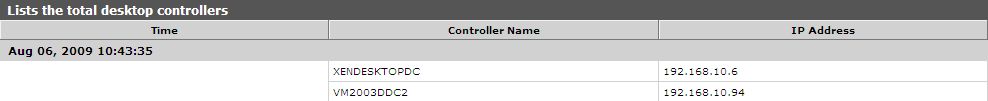
Figure 1 : The detailed diagnosis of the Total desktop controllers measure
The detailed diagnosis of the Total desktop groups measure reveals the names of the desktop groups managed by a farm.
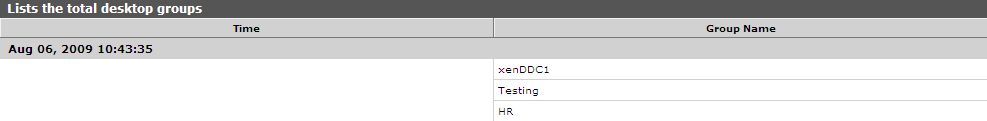
Figure 2 : The detailed diagnosis of the Total desktop groups measure
The detailed diagnosis of the Available desktop groups measure reveals the names of the desktop groups that are currently available.
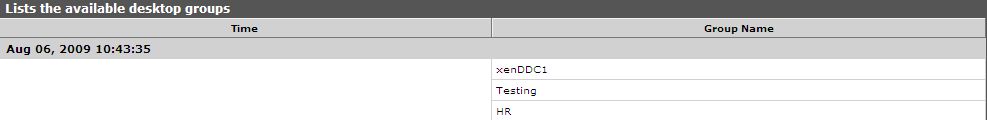
Figure 3 : The detailed diagnosis of the Available desktop groups measure