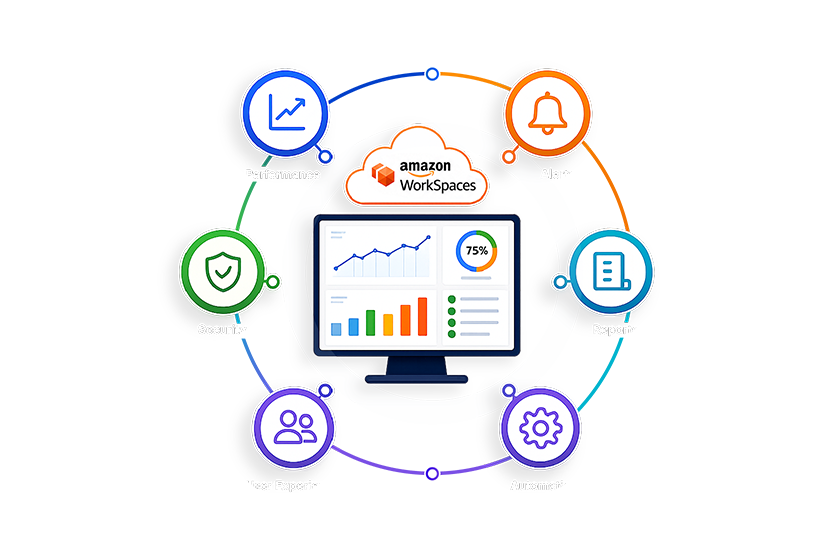
Amazon WorkSpaces Monitoring Software: Enterprise Buyer’s Guide
 Amazon WorkSpaces is a powerful option for delivering cloud desktops at enterprise scale, but the platform only performs well when it is monitored with the same level of care as any mission-critical application. This guide explains how Amazon WorkSpaces work, why monitoring matters, what to measure, and how to choose the right monitoring software for a modern enterprise environment.
Organizations that depend on virtual desktops need more than basic availability checks. They need visibility into login times, session stability, endpoint conditions, resource bottlenecks, application health, security signals, and user experience trends, all in one place. That is where enterprise monitoring becomes valuable, especially when teams want to reduce troubleshooting time and improve the experience for every user.
What is Amazon WorkSpaces?
Amazon WorkSpaces is Amazon’s managed desktop service for delivering virtual desktops to users in the cloud. Instead of building and maintaining desktop infrastructure on-premises, enterprises can provision desktops through AWS and manage them centrally while giving users access from supported clients and devices.
For IT teams, the appeal is simple: desktops can be standardized, secured, and scaled more easily than traditional endpoints. At the same time, the service introduces a monitoring challenge because the user experience now depends on cloud services, internet connectivity, client performance, and application behavior all working together.
How Amazon WorkSpaces Works
Users connect to a WorkSpace through a client, and AWS manages the desktop delivery, supporting cloud infrastructure, and related control-plane activity. AWS publishes WorkSpaces data points to Amazon CloudWatch, which allows teams to collect metrics and monitor service behavior over time.
AWS also supports events and logging that help track user logins, API activity, and service interactions. CloudWatch Events, now handled through Amazon EventBridge in many workflows, can help teams respond when login events occur, while AWS CloudTrail records the actions taken by users, roles, and AWS services in WorkSpaces. This combination makes it possible to monitor both performance and activity, but it still does not automatically explain the full user experience.
Common Enterprise Deployment Models
Enterprises commonly use Amazon WorkSpaces for full-time employees, contractors, seasonal workers, and secure remote access scenarios. The exact deployment model depends on user count, access patterns, compliance needs, application mix, and whether desktops need to be persistent or more task-oriented.
Large organizations often combine WorkSpaces with identity services, business applications, storage systems, and network controls to create a complete digital workspace. That means the monitoring strategy also has to be broader, because performance issues may emerge from multiple layers instead of a single desktop instance.
Why Monitoring Amazon WorkSpaces Matters
Monitoring matters because users judge the service by responsiveness, not by infrastructure status alone. A WorkSpace can be available and still feel slow, unstable, or frustrating if login paths, session latency, or application response times are poor.
Enterprise monitoring gives IT teams the context they need to identify where the issue starts and how far it spreads. That context is critical in a cloud desktop environment, where the user, endpoint, network, cloud service, and apps all influence the final experience.
User Experience Challenges
User experience problems are often the most visible symptoms of trouble in Amazon WorkSpaces. Slow logins, laggy mouse movement, delayed keystrokes, or app freezes can all happen even when the desktop appears healthy from a basic uptime perspective.
The challenge is that users do not care which layer failed; they only know the desktop feels broken. Good monitoring therefore needs to measure the full journey, from login to active session behavior, so IT can see how users are actually experiencing the service.
Performance Bottlenecks
Performance bottlenecks can show up in CPU, memory, disk I/O, network quality, or the applications running inside the desktop. A desktop may be undersized for a workload, or an app may consume resources in a way that causes session-wide slowdowns.
These issues are often intermittent, which makes them harder to diagnose without historical trends and correlated metrics. In addition, performance may differ by region, office location, user profile, or time of day, so continuous monitoring is more useful than periodic manual checks.
Security & Compliance Visibility
Amazon WorkSpaces also needs monitoring from a security and compliance perspective. CloudTrail provides a record of actions taken by users, roles, and AWS services, including the IP address used, the request details, and the time of the event.
That level of visibility matters for auditing, investigations, and governance. It becomes even more important when organizations support remote access, contractor desktops, regulated workloads, or environments where activity tracking is part of compliance reporting.
Common Amazon WorkSpaces Performance Issues
WorkSpaces performance issues often surface as end-user complaints first, but the underlying cause can live anywhere from the endpoint to the cloud desktop to the application layer. A strong monitoring strategy should help teams move from symptom to cause quickly, instead of forcing them to inspect each layer manually.
Slow Login Times
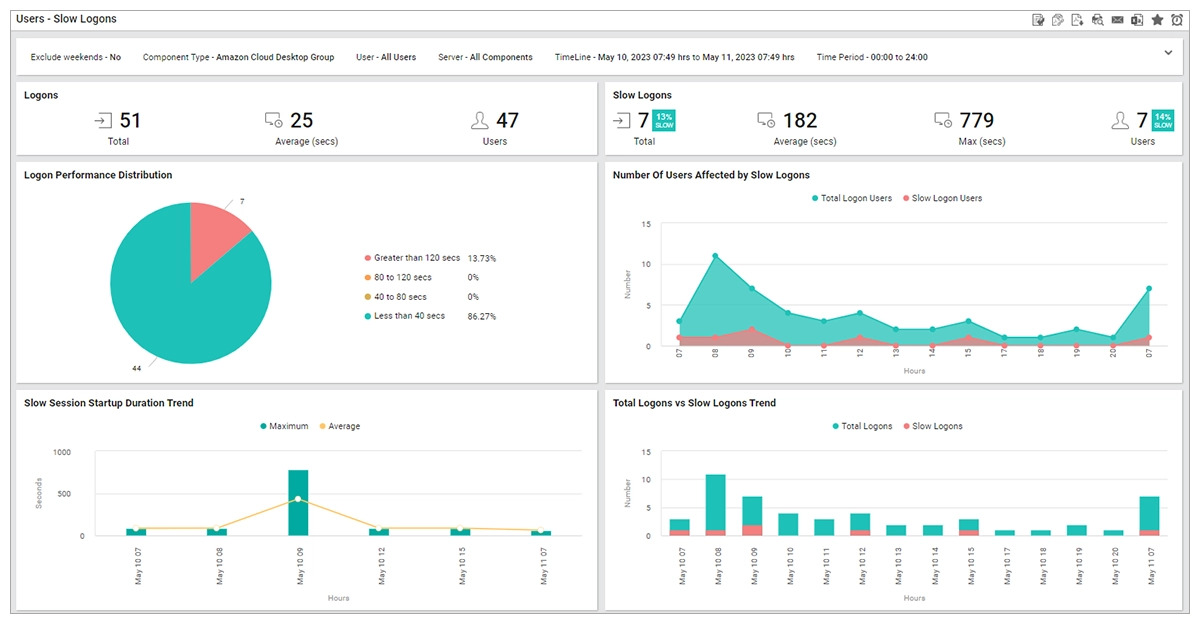
Slow login times are one of the most common complaints in virtual desktop environments. Delays may happen during authentication, profile initialization, policy application, app launch, or session setup, and the real cause is not always obvious without detailed monitoring.
When login duration trends are tracked over time, IT teams can see whether the issue is isolated or recurring. That helps prioritize fixes, especially in environments where many users start their work at the same time.
High Latency
High latency can make a desktop feel sluggish even when compute and storage resources look healthy. It affects keyboard response, pointer movement, screen refresh, and app interaction, which can quickly reduce productivity.
Latency issues are often tied to the user path, network congestion, geographic distance, or internet instability rather than the WorkSpace itself. That is why monitoring should include both cloud-side and user-side visibility whenever possible.
Session Disconnects
Session disconnects disrupt work immediately and can come from unstable network paths, client problems, endpoint failures, or backend issues. In many cases, the same user may reconnect successfully, which makes the issue seem random unless it is tracked carefully.
A good monitoring platform should correlate disconnect events with session health, endpoint status, and network conditions. That correlation helps teams identify whether the true problem is the desktop, the client, or the connectivity path.
Resource Bottlenecks
When a WorkSpace runs low on CPU or memory, the user experience often deteriorates in very visible ways. Apps may take longer to open, windows may stop responding, and the whole desktop may feel overloaded.
Resource bottlenecks may point to poor sizing, runaway apps, background processes, or workload changes that were not anticipated during provisioning. Without monitoring, teams may only see the end result, not the pattern that created it.
Application Performance Issues
Sometimes the WorkSpace infrastructure is functioning properly, but the applications inside the desktop are slow or unstable. In that case, desktop-level metrics alone are not enough because the problem may sit in the app, its dependency chain, or the network path to a backend service.
This is why enterprise monitoring needs application-level visibility, not just host-level checks. When application health is tied to user sessions and desktop performance, troubleshooting becomes faster and more accurate.
Key Amazon WorkSpaces Metrics IT Teams Should Monitor
The most useful metrics are the ones that reveal how infrastructure behavior affects the user. A practical monitoring strategy should cover the session, desktop, network, storage, and application layers together.
User Session Metrics
Session metrics show how users are actually interacting with the service. Key indicators include login success, login duration, session duration, disconnect frequency, reconnect patterns, and overall session health.
These metrics are important because they directly reflect service quality from the user’s point of view. They also help teams spot abnormal trends before a full outage develops, especially in environments with large user populations.
CPU & Memory
CPU and memory metrics are essential for understanding whether a WorkSpace is sized correctly for its workload. High usage can indicate a heavy application, inefficient workload, or too many processes competing for resources.
Tracking these values over time also helps distinguish between temporary spikes and chronic overload. That distinction is useful for capacity planning, desktop sizing, and root cause analysis.
Network Performance
Network performance is critical in remote desktop environments because it directly affects responsiveness. Latency, packet loss, and connection stability all influence the user’s perception of speed and reliability.
Monitoring should consider both the AWS side and the path the user takes to reach the desktop. If the endpoint or internet connection is unstable, the user may experience problems even when the WorkSpace itself is healthy.
Storage Performance
Storage performance matters because file access, profile loading, and home-folder operations can affect the entire session. Delays in these areas may look like a general desktop slowdown when the root cause is actually storage related.
This is especially important in enterprise environments where users depend on shared data, roaming profiles, or storage-heavy workflows. Monitoring storage behavior helps teams diagnose whether the bottleneck is in the WorkSpace, the storage layer, or the application itself.
Application Health
Application health monitoring shows whether the tools users rely on are responsive and stable inside the WorkSpace. It can include app launch times, response behavior, availability, and other user-visible signals.
This layer is important because an application can fail or slow down even when the desktop infrastructure is fine. By monitoring application health alongside session and host metrics, teams get a more complete view of service quality.
Native AWS Monitoring vs Third-Party Monitoring
AWS provides strong native monitoring options for WorkSpaces, but those tools have a clear scope. They are very useful for service metrics, logs, and events, yet enterprise teams often need deeper visibility into the user experience and root cause across multiple layers.
Amazon CloudWatch
Amazon CloudWatch is the core AWS monitoring service for metrics, alarms, and dashboards. Amazon WorkSpaces publishes data points to CloudWatch, which means teams can verify whether desktops are performing as expected and alert on thresholds.
CloudWatch is valuable for real-time monitoring and trend analysis. However, it is strongest when used as a starting point rather than the only source of truth for a complex enterprise desktop environment.
AWS CloudTrail
CloudTrail records actions taken by users, roles, and AWS services within WorkSpaces. It can show who made a request, from which IP address, when the request was made, and other request details.
That makes CloudTrail extremely useful for security and compliance investigations. It helps answer the “who did what” question, but it does not replace the need for performance and experience monitoring.
Enterprise Monitoring Platforms
Enterprise monitoring platforms go beyond cloud logs and basic metrics by correlating data across the end-user experience, endpoints, apps, and infrastructure. This broader view is especially useful in digital workspace environments where a performance issue can start in one layer and appear in another.
eG Enterprise from eG Innovations is an end-to-end monitoring solution that delivers in-depth Amazon WorkSpaces performance visibility and helps teams identify and triage issues quickly. It is also presented as a specialized digital workspace monitoring platform for providers including Amazon WorkSpaces.
Azure Monitor for Azure Virtual Desktop
For organizations managing both AWS and Azure desktop platforms, it is also useful to compare AWS tooling with Azure Monitor for Azure Virtual Desktop (AVD). That comparison helps teams evaluate how native cloud monitoring supports insights into sessions, performance, and diagnostics across different virtual desktop ecosystems.
This matters in multi-cloud environments because the monitoring standard should be consistent even when the underlying platform changes. Teams often want one strategy for user experience, alerting, reporting, and troubleshooting, regardless of whether desktops run on AWS or Azure.
Essential Features in Amazon WorkSpaces Monitoring Software
A strong monitoring platform should do more than confirm uptime. It should help teams detect issues early, understand what users are experiencing, and reduce the time required to resolve problems.
Real-Time Monitoring
Real-time monitoring is essential because WorkSpaces problems affect users immediately. Teams need live visibility into desktop health, active sessions, and emerging bottlenecks so they can act before complaints spread.
Real-time data also makes it easier to separate current incidents from historical trends. That distinction is useful when multiple users report similar symptoms at once.
End User Experience Monitoring
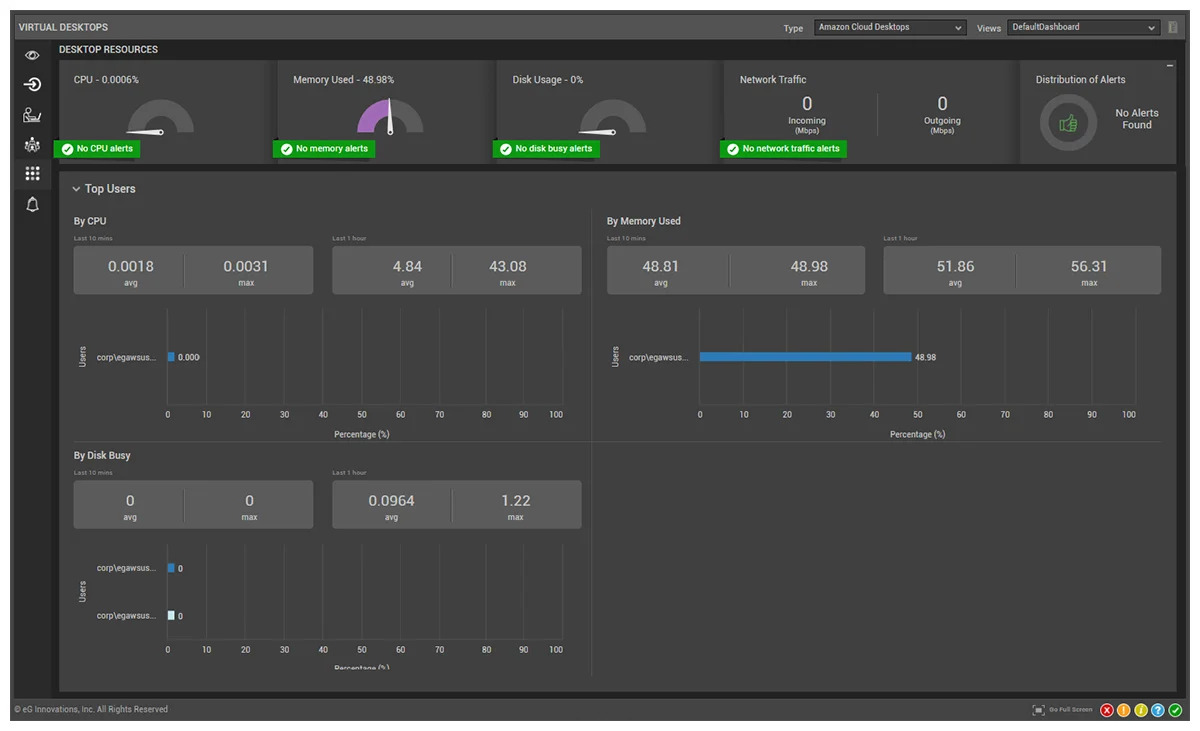
End user experience monitoring focuses on what the user feels rather than what the cloud infrastructure reports. It becomes especially important in DaaS environments because a healthy platform does not guarantee a smooth desktop experience. Many organizations are also introducing Digital Employee Experience (DEX) strategies to formalize the approach of focusing on the end users and their productivity.
This capability helps capture login pain points, session sluggishness, and app response issues from the user’s perspective. In enterprise settings, that perspective often makes the difference between guessing and knowing.
Synthetic Monitoring
Synthetic monitoring simulates user actions to validate login and session behavior proactively. It can help teams spot regressions, compare performance across locations, and test the service before real users are impacted.
For Amazon WorkSpaces, synthetic monitoring of full user workflows using full-session simulation is particularly useful for ensuring applications are both available and performant. These types of synthetic check can provide an early warning signal of when the user journey begins to slow down, even if no one has filed a ticket yet. Learn more: Synthetic Monitoring of Amazon Workspaces.
Endpoint Monitoring
Endpoint monitoring matters because the local device, client health, and network path can all influence the WorkSpaces experience. If the endpoint is unstable, the user may blame the cloud desktop even though the real issue starts locally.
A good platform should therefore show how endpoint conditions affect session quality. This is especially helpful for supporting distributed workforces that connect from branch offices, home networks, or unmanaged environments.
Alerting
Alerting should notify teams when meaningful thresholds are crossed and provide enough context to investigate quickly. The best alerts reduce noise and focus attention on issues that affect real users.
Effective alerting is especially important in large environments where many desktops can generate large volumes of telemetry. Without good alert design, operations teams can spend too much time chasing low-priority noise.
Learn more about best practices for setting alert thresholds, see: White Paper | Make IT Service Monitoring Simple & Proactive with AIOps Powered Intelligent Thresholding & Alerting.
Dashboards and Reporting
Dashboards help teams understand service health at a glance. Reports then add historical context, trend analysis, and stakeholder communication value.
For enterprise teams, reporting should help answer questions like whether login times are improving, which user groups are most affected, and where performance is trending downward. That kind of visibility supports both operations and planning.
Root Cause Analysis
Root cause analysis is one of the biggest differentiators between basic monitoring and enterprise monitoring. Instead of just showing that a metric crossed a threshold, the platform should help explain why the issue happened and where it began.
That requires correlation across desktops, endpoints, applications, cloud infrastructure, and network conditions. When those layers are connected, troubleshooting becomes far faster and much less manual.
AI-assisted Insights
AI-assisted insights help teams handle volume and complexity more efficiently. They can identify anomalies, surface likely dependencies, and reduce the amount of manual investigation required to prioritize incidents.
In modern enterprise environments, AI is valuable because monitoring data can be large, noisy, and time-sensitive. Intelligent prioritization can make a real difference when multiple desktops or services are affected at the same time.
How to Choose the Right Amazon WorkSpaces Monitoring Solution
The best monitoring solution is the one that fits the actual environment, not just the feature list. Teams should evaluate scale, integration needs, operational effort, and budget before making a decision.
Deployment Size
Smaller environments may do well with AWS-native tools alone, especially if the user base is limited and the architecture is simple. Larger or more distributed deployments usually need deeper visibility because the number of variables grows quickly.
If a deployment includes many users, regions, apps, or support teams, a richer monitoring platform becomes more valuable. That is because troubleshooting complexity increases with scale.
Scalability
Scalability matters because monitoring should remain effective as WorkSpaces usage expands. The platform should handle more desktops, more telemetry, and more stakeholders without becoming difficult to manage.
A scalable tool also helps standardize monitoring practices across business units or geographic regions. That consistency is important when teams want a single operational model instead of a collection of disconnected dashboards.
Integration Requirements
The monitoring solution should fit into the surrounding ecosystem, including AWS services, identity systems, ITSM workflows, and reporting processes. Integration makes it easier to move from alert to investigation to action.
In enterprise environments, that can mean connecting with ticketing systems, business dashboards, or multi-cloud monitoring strategies. The easier the integration, the less manual effort is required to keep operations moving.
Budget Considerations
Budget decisions should include more than software licensing. They should also account for downtime, lost productivity, support effort, and the time saved by faster diagnosis.
In many cases, the cheapest tool is not the lowest-cost option overall if it creates more manual work or misses problems early. That is why many enterprises evaluate value in terms of operational efficiency rather than price alone.
Amazon WorkSpaces Monitoring Best Practices
Good monitoring is not just about the tool; it is also about the process. The best results come from baselining normal behavior, reviewing trends regularly, and connecting user-experience data to infrastructure signals.
- Track user-experience metrics first, then connect them to infrastructure and application metrics.
- Set threshold-based alerts for login time, disconnects, latency, and resource saturation.
- Use dashboards to compare performance by location, time of day, and user group.
- Correlate WorkSpaces health with network and endpoint conditions to avoid misdiagnosis.
- Review trends regularly so desktops can be right-sized and recurring issues caught early.
- Combine AWS-native logging with enterprise monitoring when security, performance, and user experience all matter.
Another best practice is to treat monitoring as an ongoing improvement process rather than a one-time setup. As usage changes, teams should revisit thresholds, dashboards, and alert logic to keep the monitoring model aligned with real-world behavior.
Conclusion
Amazon WorkSpaces can deliver secure, scalable cloud desktops, but only when visibility is strong across the full user journey. Monitoring is essential because the biggest pain points in virtual desktops often show up first as user experience issues, not as obvious infrastructure failures.
AWS-native tools such as CloudWatch and CloudTrail provide a useful foundation, especially for metrics, alerts, and auditing. However, enterprise teams usually need a deeper monitoring platform to understand session behavior, endpoint impact, application health, and root cause across the entire digital workspace.
For organizations looking to improve support efficiency and user satisfaction, the best strategy is to combine AWS-native telemetry with enterprise monitoring that gives end-to-end visibility. That approach is especially valuable for complex environments, multi-region deployments, and teams comparing cloud workspace monitoring across platforms such as AWS and Azure.
eG Enterprise is an Observability solution for Modern IT. Monitor digital workspaces,
web applications, SaaS services, cloud and containers from a single pane of glass.
Frequently Asked Questions
Amazon WorkSpaces monitoring is the process of tracking desktop health, session performance, logs, and user experience so issues can be detected and service quality maintained.
The most important metrics include user sessions, login times, CPU, memory, network latency, storage behavior, and application health.
CloudWatch provides metrics, dashboards, and alarms, and it is a strong native starting point. However, AWS also uses CloudTrail and related event logging for broader visibility, and enterprise teams often need deeper end-user and cross-layer monitoring as well.
Common causes include high latency, overloaded desktops, network instability, slow login paths, storage delays, and application issues.
User experience is monitored by tracking session health, login duration, disconnects, latency, and synthetic test results that simulate common user actions.
AWS native monitoring provides essential service-level visibility through tools like CloudWatch and CloudTrail. Third-party monitoring adds deeper context, correlation, end-user experience insight, and faster root cause analysis.
The best tool is the one that matches the environment’s scale, integration needs, and need for end-user visibility. eG Enterprise from eG Innovations is a purpose-built monitoring solution for Amazon WorkSpaces for enterprise environments.
Enterprises should monitor WorkSpaces continuously and review performance trends on a regular cadence, such as daily or weekly, depending on the environment’s size and criticality.