Best Citrix Monitoring Tools for End-to-End Performance Visibility
It is 9:02 on Monday morning. Within minutes, hundreds of employees hit the logon button at once, and the helpdesk queue fills with the same three words: Citrix is slow. The team scrambles. Is it the Delivery Controller? Active Directory? The profile server? Storage? Without the right Citrix monitoring tools, that question can take hours to answer, and every minute is a roomful of people who cannot work.
This is the daily reality of running virtual apps and desktops. When Citrix performance dips, productivity dips with it. Logons stall, sessions freeze, and applications crawl. Virtual apps and desktops are also among the most performance-sensitive services in the enterprise. Most processing happens in the data center, users often connect from thin clients, and every keystroke travels to a server and back. A small glitch in the network, a Citrix tier, or a supporting service shows up immediately as a poor user experience.
That is why full stack monitoring tools matter for Citrix. Watching the Citrix layer alone is rarely enough; to find the real cause fast, you need visibility from the user session all the way down to the infrastructure.
What Are Citrix Monitoring Tools?
These tools track the health, performance, and user experience of a Citrix Virtual Apps and Desktops or Citrix DaaS environment. They measure what users actually feel, such as logon time and application responsiveness, and connect those experiences to the underlying systems that deliver them.
How Citrix Monitoring Works
Good Citrix monitoring collects metrics from every stage of a user session: web access and authentication, session brokering, profile and policy load, application launch, and interaction over the ICA/HDX/EDT protocols. It then correlates those metrics with server, network, storage, and virtualization performance, so a symptom can be traced back to its cause.
Key Components of a Citrix Environment to Monitor
A Citrix service is a chain of dependent tiers. A problem in any one of them can degrade the experience for many users. The components that need continuous monitoring include:
- Citrix Virtual Apps and Desktops: the published apps, virtual desktops, and the session hosts that deliver them.
- Delivery Controllers: session brokering, registration, and load management.
- Citrix Gateway: secure remote access, authentication, and the front door to the environment.
- Hypervisors and infrastructure: the virtualization platform, servers, storage, network, Active Directory, and supporting services every session depends on.
Why Native Citrix Monitoring Is Not Enough
Built-in tools such as Citrix Director give system administrators useful session-level visibility, but they were never designed to see the whole picture. They do not cover every Citrix tier, and they offer little insight into the non-Citrix systems (endpoint hardware, network, Active Directory, storage, and virtualization) that frequently cause the slowdown. When those tiers are the culprit, native tools tell you a session is slow without telling you why.
Common Performance Issues in Citrix Environments
Most Citrix complaints fall into a handful of recurring patterns. Recognizing them helps you choose monitoring that can actually diagnose them.
Slow Logon Times
The Citrix logon is a multi-step process: authentication, session brokering, profile load, group policy processing, and logon scripts. Slowness in any step, or in a dependency like a remote profile server or Active Directory, drives up total logon time. Diagnosis means breaking the logon into stages, not just timing the whole thing.
ICA Session Latency and Disconnects
Citrix sessions are interactive and session-oriented. High latency on the ICA/HDX/EDT channel shows up as laggy screens and delayed keystrokes, while network instability can drop sessions entirely. A few seconds of poor connectivity can prevent an employee working and trigger a fresh call to the service desk.
High Resource Utilization in VDI Infrastructure
When session hosts or virtual desktops run short on CPU, memory, or I/O, everyone on that host feels it. Memory leaks, runaway processes, and undersized VMs are common offenders, and adding hardware rarely fixes a root cause that lives in a misbehaving application or policy.
Application Launch Delays
Users launch applications inside an already established session, and a slow launch is one of the most visible experience problems. Delays can come from the application server, backend dependencies, storage, or contention on the session host, which is why launch time needs to be tracked in context.
Endpoint Problems
Citrix infrastructure is designed to support remote working and the troubleshooting performance issues on the end-user device is essential. Administrators must be able to troubleshoot common problems such as poor home Wi-Fi or ISP issues on a range of endpoints such as thin clients, laptops and macOS devices.
Key Features to Look for in Citrix Monitoring Tools
Not every tool that claims Citrix support can troubleshoot Citrix. The features below separate alerting from genuine diagnosis.
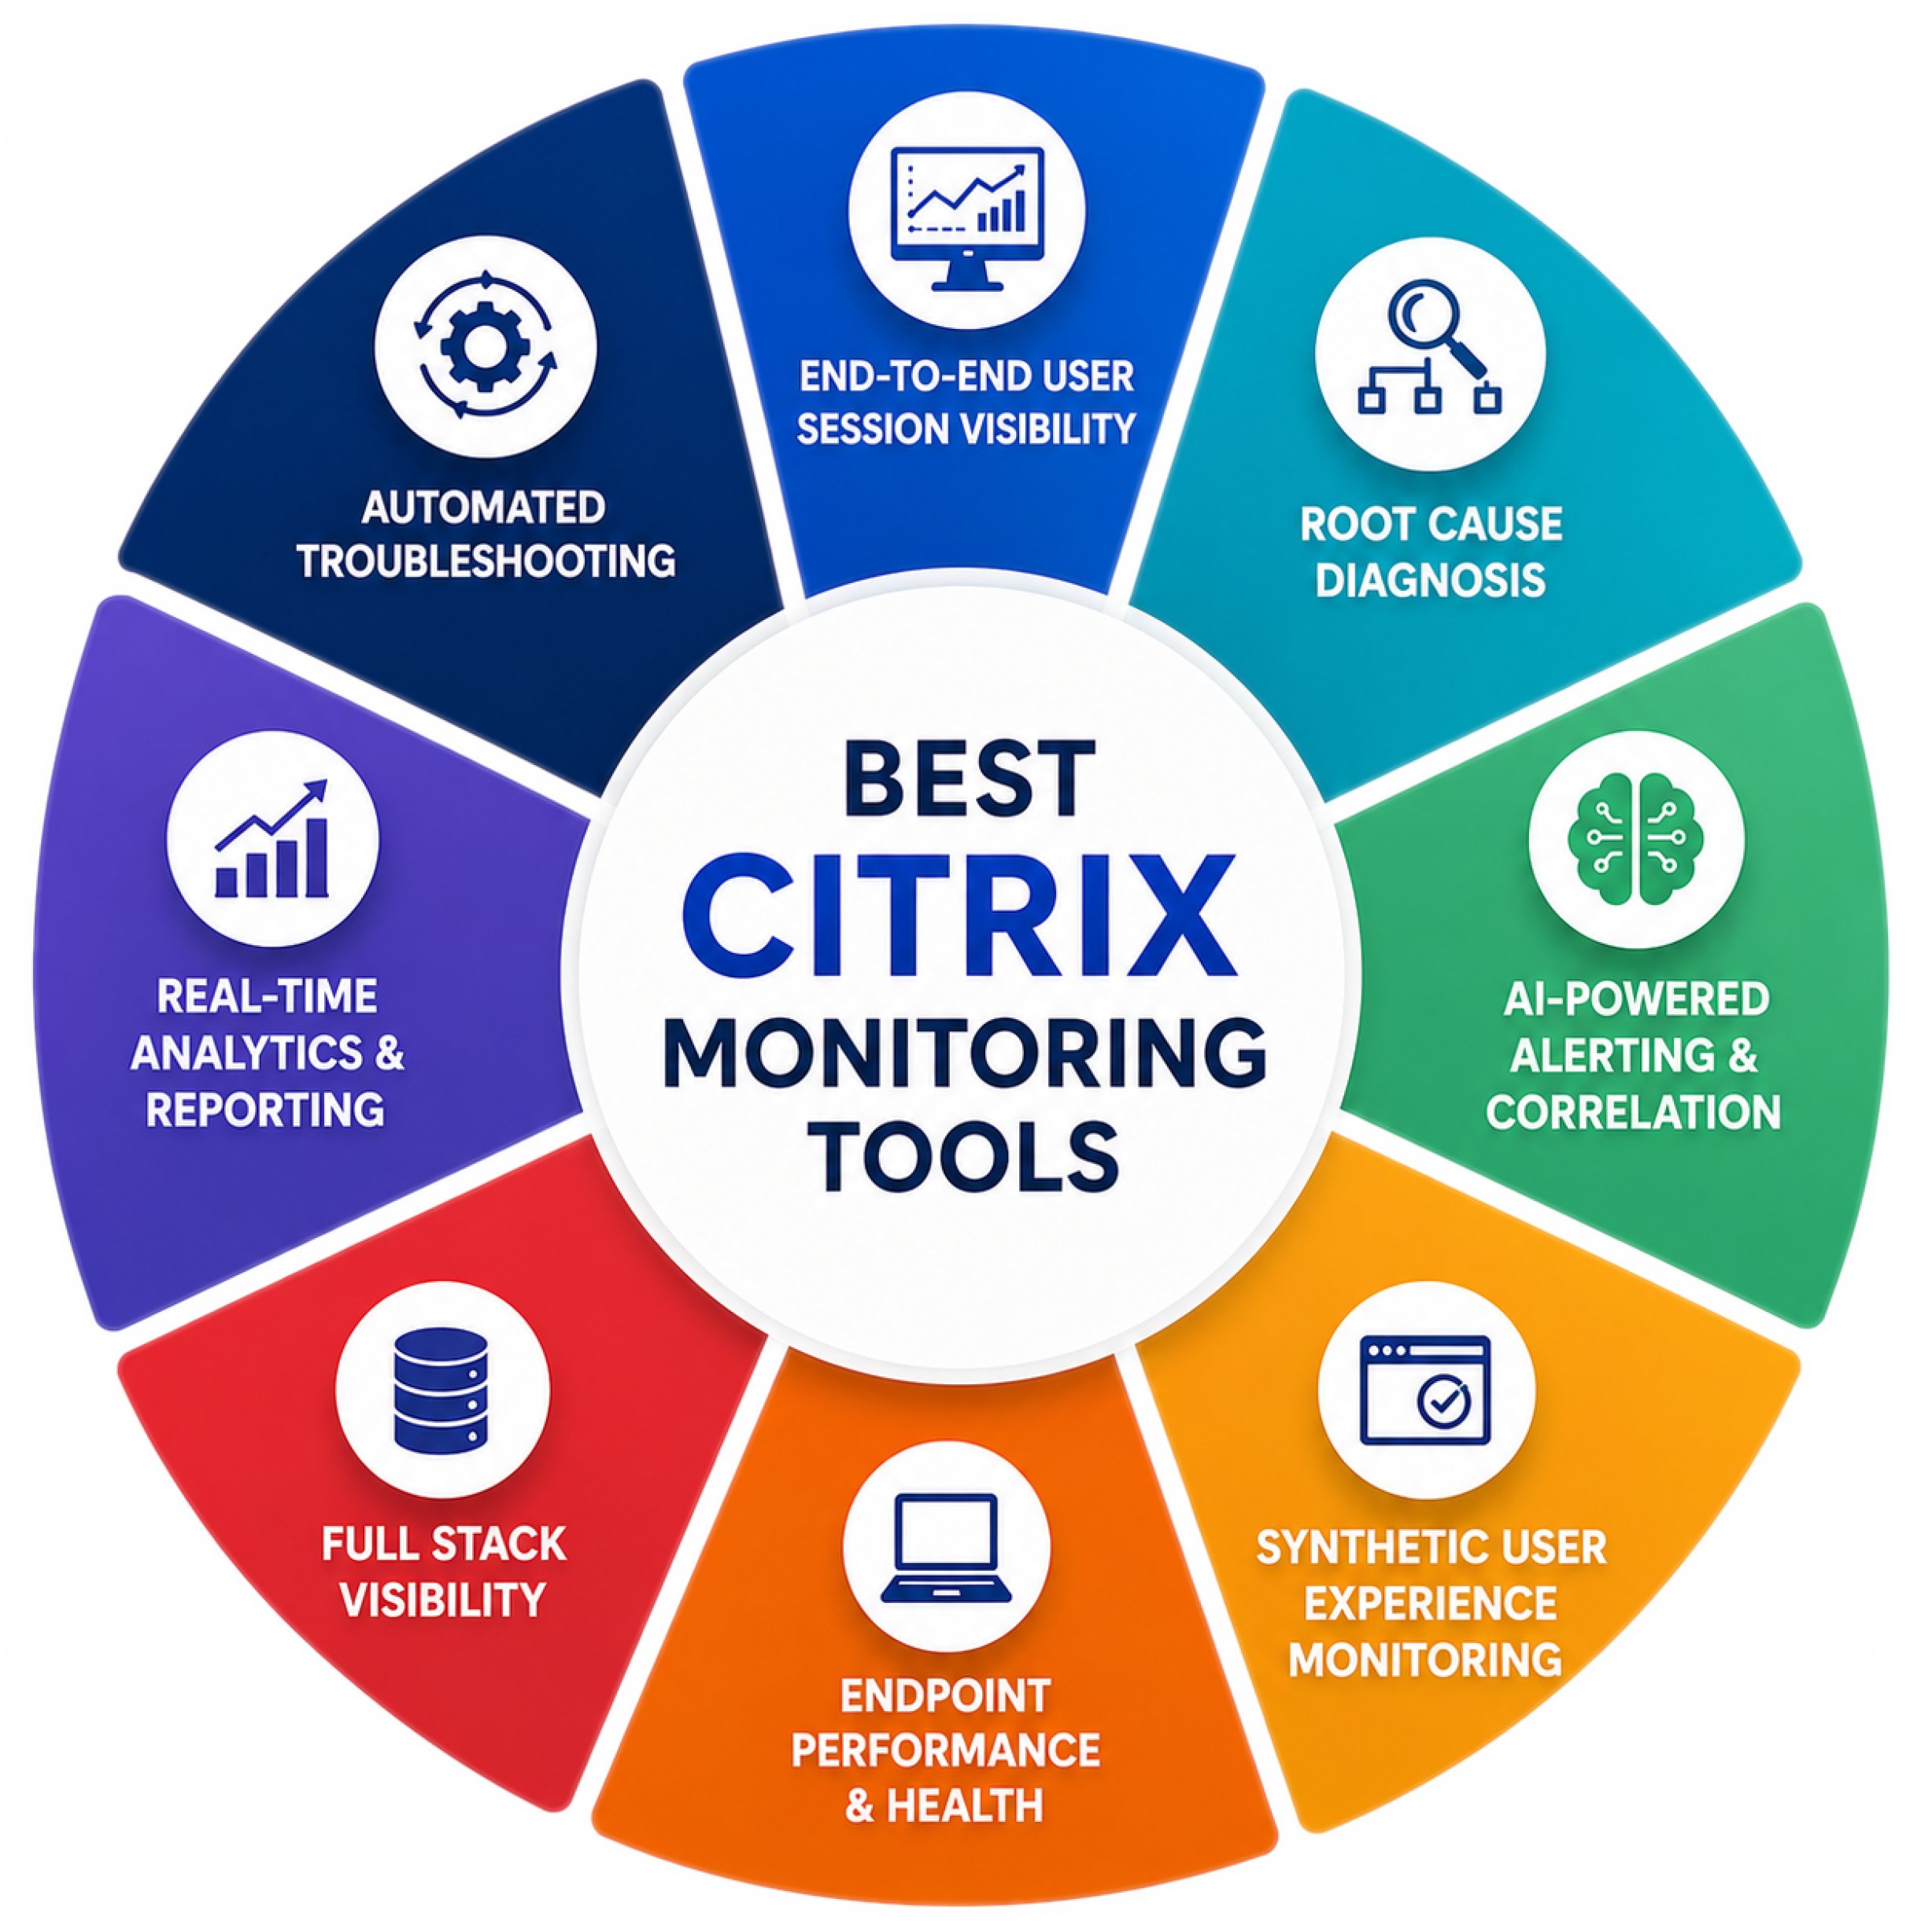
End-to-End User Session Visibility
Look for a complete breakdown of each session: logon stages, application launches, active and idle time, and the ICA/HDX/EDT channel metrics behind screen refresh and input latency. Session-level detail for every user is the foundation of fast troubleshooting.
Real-Time Performance Analytics
Performance problems are time sensitive. The tool should surface live metrics and trends so teams can spot a developing issue, a host filling up or latency climbing, before it becomes a flood of helpdesk tickets.
Root Cause Diagnosis Across Infrastructure
Because Citrix depends on so many tiers, a monitoring tool needs to correlate across all of them and point to the tier responsible. The goal is to answer “why is the session slow” in minutes, not to hand an admin twenty dashboards to cross-reference by hand.
AI-Powered Alerting and Correlation
Static thresholds generate noise. Tools that learn normal behavior, baseline it automatically, and correlate related events cut down false alarms and group symptoms into a single, actionable root cause. To learn more about best practices for metric thresholds and alerting, see: White Paper | Make IT Service Monitoring Simple & Proactive with AIOps Powered Intelligent Thresholding & Alerting.
Synthetic User Experience Monitoring
Synthetic monitoring simulates logons and full sessions on a schedule, including when no real users are active. It is valuable for benchmarking readiness across locations and catching availability problems early, and for Citrix it requires simulation that can drive a real session rather than a simple web check.
Endpoint Performance and Health
Citrix monitoring tools need to offer capabilities that enable IT teams to support remote and hybrid workers. Tools that can monitor system and hardware behavior of endpoints, endpoint network connectivity, and local user experience are essential when problems are associated with the endpoint.
Why Full Stack Monitoring Tools Improve Citrix Performance
The single biggest reason Citrix troubleshooting drags is a narrow field of view. These tools close that gap.
Monitoring Beyond the Citrix Layer
Problems outside the Citrix tiers, in the network, Active Directory, storage, or virtualization, are a leading cause of Citrix performance issues, and monitoring that stops at the Citrix layer cannot see them. Full stack visibility brings the supporting infrastructure into the same view.
Infrastructure-to-Application Dependency Mapping
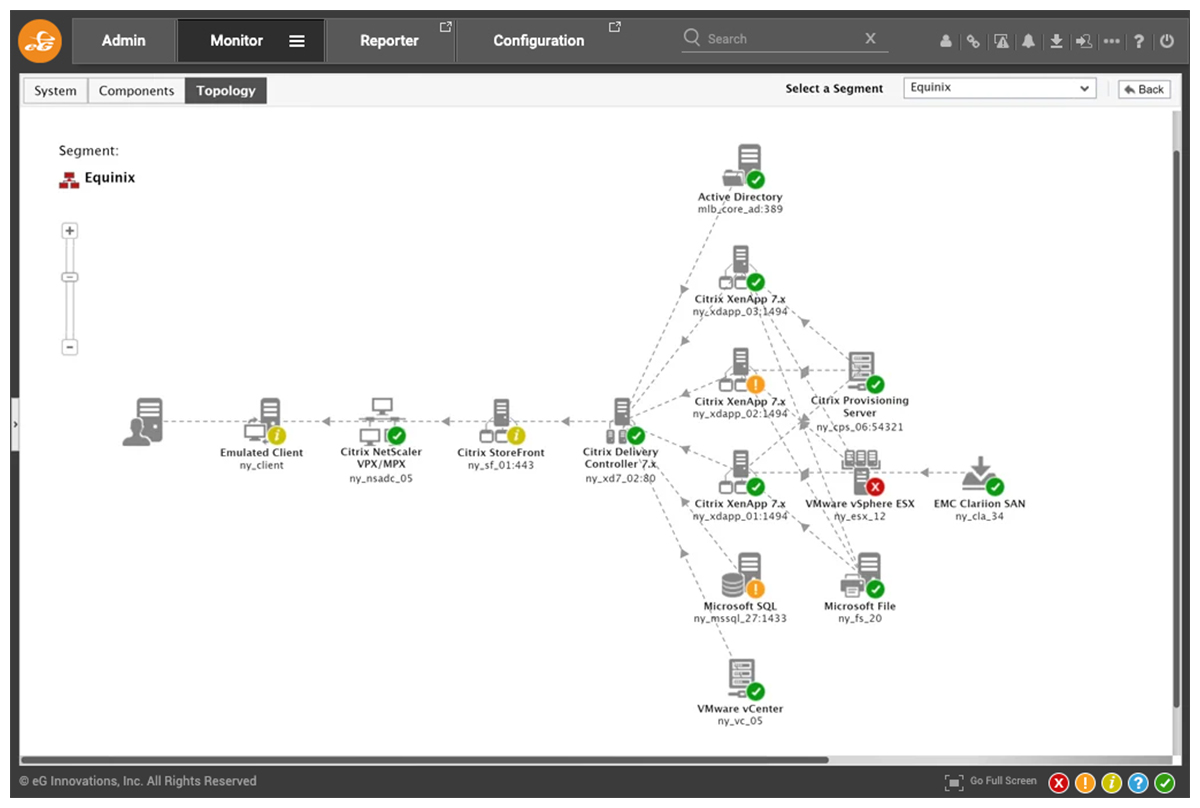
When a tool understands how each tier connects to the next, it can follow a slow session down to the exact dependency that broke. Automatic dependency mapping turns a guessing game into a guided path to the cause.
Faster Mean Time to Resolution (MTTR)
Correlated, full-stack visibility removes the finger-pointing between Citrix, network, and infrastructure teams. Everyone works from one version of the truth, which is the most direct route to lower MTTR and fewer escalations.
Improved Digital Employee Experience
Ultimately, monitoring exists to keep people productive. Catching a slow logon or a struggling host before users feel it protects the digital employee experience, which is the metric the business actually cares about.
Best Practices for Citrix Performance Monitoring
Establishing Baseline Performance Metrics
You cannot recognize “abnormal” without a definition of “normal.” Baseline logon times, application launch times, latency, and resource usage, so alerts reflect real deviations rather than arbitrary numbers. Modern Citrix monitoring tools offer AIOps-powered auto-baselining that will automatically learn and alert unusual patterns and anomalies.
Monitoring Hybrid and Multi-Cloud Citrix Deployments
Citrix now spans on-premises, Citrix DaaS, and hybrid and multi-cloud setups. Make sure your monitoring covers every model in one console, so a workload running in the cloud is no less visible than one in the data center.
Proactive Capacity Planning
Monitoring data is a planning asset, not just a troubleshooting one. Use utilization trends to right-size virtual machines, balance workloads across hosts, and forecast when you will need more capacity, before users run into a wall.
Automating Troubleshooting Workflows
Repetitive issues such as stuck sessions or VDA registration problems are good candidates for automated remediation. Automating known fixes frees the team to focus on the problems that genuinely need a human. Learn more about what types of auto-remediation are possible for Citrix environments, see: Fixing Citrix Issues with eG Enterprise’s Automation | eG Innovations.
How eG Innovations Helps Monitor Citrix Environments
eG Enterprise is a Citrix Ready certified monitoring solution purpose-built for Citrix environments, combining deep Citrix domain expertise with full-stack visibility across more than 650 supported technologies.
Deep Citrix Monitoring Capabilities
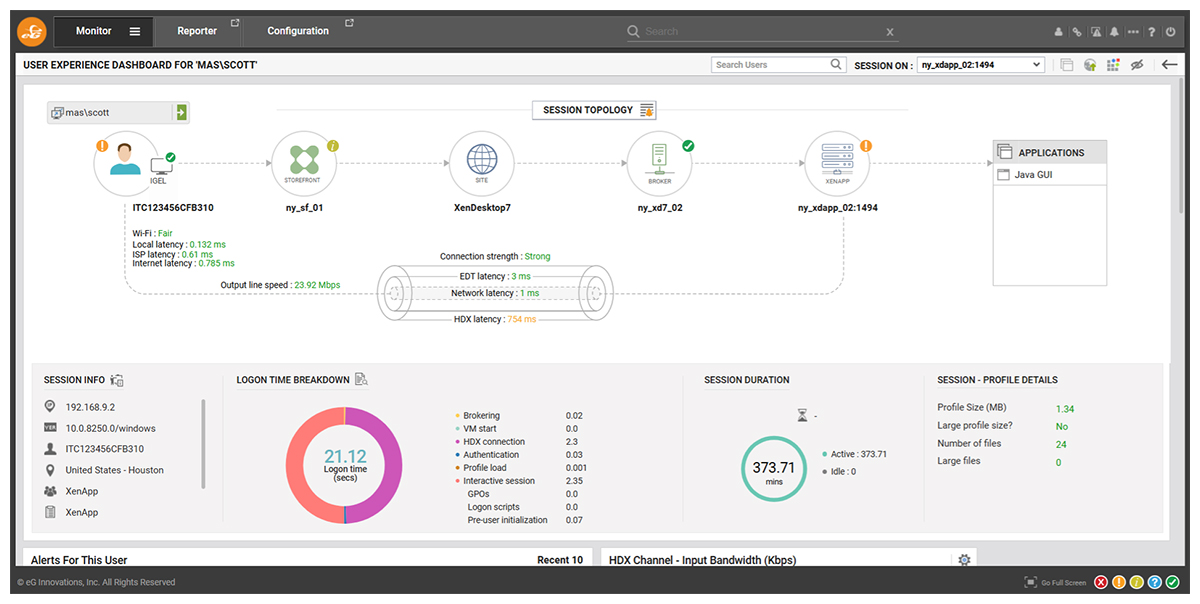
eG Enterprise monitors every tier of the Citrix environment, including Virtual Apps and Desktops, Delivery Controllers, StoreFront, Citrix Gateway, Provisioning Services, and the license server. It tracks the full logon sequence, application launch times, ICA/HDX channel metrics, and session activity, so admins can isolate exactly which step is hurting users.
Full Stack Visibility Across Applications and Infrastructure
eG Enterprise consolidates siloed tools into a single pane of glass, correlating Citrix performance with Active Directory, network, storage, and virtualization in one view. This is the full-stack coverage that lets teams confirm whether “Citrix is slow” is really a Citrix problem at all.
AI-Driven Root Cause Analytics
It is impossible to analyze millions of metrics manually. eG Enterprise’s auto-baselining technology uses machine learning to automatically determine normal bounds of metrics. This technology tracks time of day, day of week behaviour of each metric and uses past history to estimate dynamic thresholds for each metric. Administrators can choose the granularity with which they apply this derived intelligence to allow thresholds to be automatically and dynamically fine-tuned.
Auto-baselining is a key to making eG Enterprise proactive and easy to use:
- Early warning alerts: Administrators get alerts to anomalies and abnormal usage of resources, unusual traffic patterns before end users are impacted.
- Less manual work: Administrators no longer need to configure thresholds one by one, for each metric, and for each system.
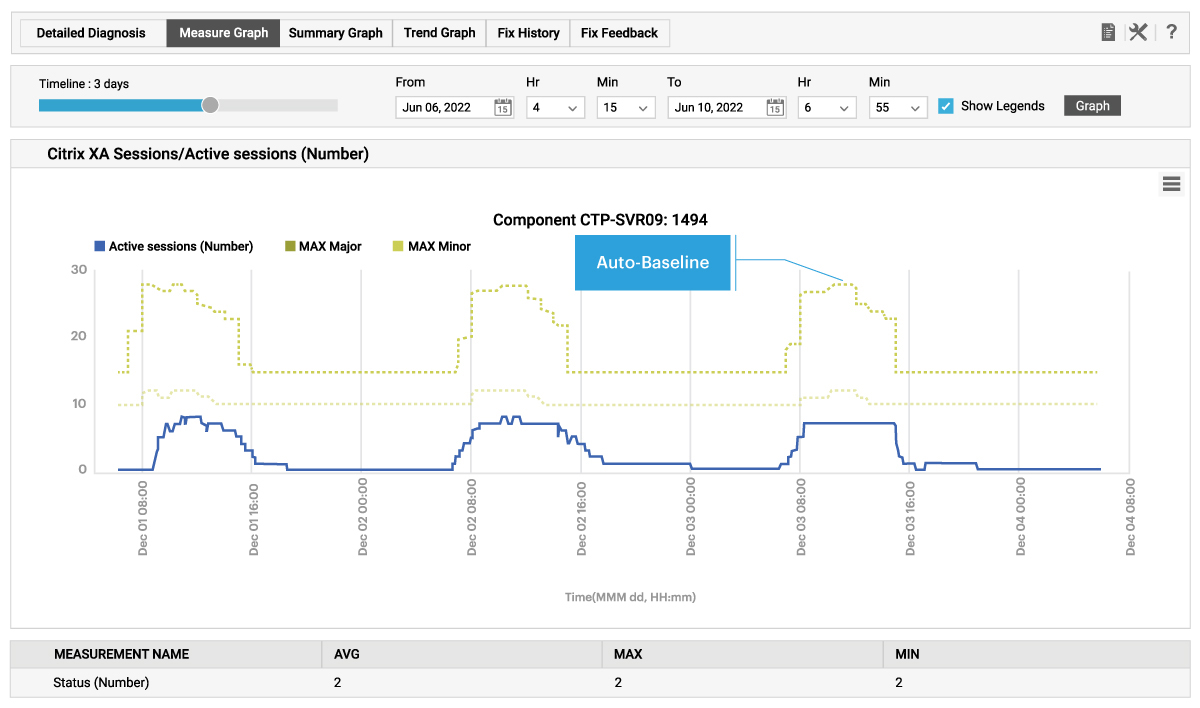
Using machine learning and automatic dependency mapping, eG Enterprise auto-baselines normal behavior and correlates related events to pinpoint the root cause of a problem. Instead of sifting dashboards, admins get a direct answer and a faster path to resolution.
Real User Experience Monitoring
eG Enterprise measures the experience of real Citrix users, logon times, screen refresh latency, and disconnects, and complements it with synthetic session simulation. Together they cover what users feel now and the readiness of the environment around the clock, on-premises or with Citrix DaaS.
Synthetic Monitoring
eG Enterprise Universal Simulation is purpose-built for secure, hybrid IT environments, powered by OCR, Universal Simulation supports web, non-web, legacy, and modern applications alike, including mixed workflows that span multiple interface types. This offers Citrix administrators the capability to proactively and continuously test realistic Citrix workflows from logon to multi-application usage.
Endpoint Performance and Health Monitoring
eG Enterprise offers monitoring for Windows, IGEL, ThinOS, ChromeOS and macOS devices. Comprehensive system and hardware monitoring includes CPU, memory, and disk utilization trends, boot and shutdown times, battery and thermal health, application crash analytics, and more. eG Enterprise also supports end-to-end network experience monitoring including Wi-Fi, ISP, VPN, and DNS, for remote and hybrid work environments.
Visibility for the Whole Organization
eG Enterprise offers a wealth of ready-to-go dashboards and reports to provide tools and visibility to the whole organization. Interactive troubleshooting dashboards suitable for L1/L2 helpdesk operators ensure only true Citrix issues are routed to the Citrix team. ITSM integrations with systems such as ServiceNow, Autotask and Freshservice ensure Citrix issues are handled with the organization’s choice of support system. A wealth of ready-built reports allow Citrix teams to provide management with visibility on SLAs and KPIs and their team’s efforts.
Conclusion
“Citrix is slow” should never cost your team a morning. The right Citrix monitoring tools turn that vague complaint into a precise answer by showing the full path from the endpoint, through a user session down to the infrastructure beneath it. Native and single-tier tools tell you something is wrong. Full stack monitoring tells you where, and why, so you can fix it before the next logon storm.
If your Citrix environment runs across virtual apps, desktops, and the many tiers that support them, see how eG Enterprise delivers end-to-end Citrix visibility and AI-driven root cause analytics. Request a demo or start a free trial at eginnovations.com/Citrix.
eG Enterprise is an Observability solution for Modern IT. Monitor digital workspaces,
web applications, SaaS services, cloud and containers from a single pane of glass.
Frequently Asked Questions
Citrix monitoring tools are software solutions that track the performance, availability, and user experience of a Citrix Virtual Apps and Desktops or Citrix DaaS environment. They measure metrics like logon time and application responsiveness and link them to the servers, network, and infrastructure that deliver each session.
Citrix monitoring is important because virtual apps and desktops are highly performance-sensitive, and slow logons or session disconnects directly reduce employee productivity. Monitoring helps IT teams detect issues early, find the root cause quickly across many dependent tiers, and keep mission-critical digital workspaces running for users.
Key Citrix metrics include logon time and its breakdown (authentication, profile load, group policy, scripts), application launch time, ICA/HDX/EDT latency and screen refresh, session disconnects, and active versus idle time. These should be tracked alongside CPU, memory, storage, network, and virtualization performance for full context.
Full stack monitoring tools extend visibility beyond the Citrix tiers to the network, endpoints, Active Directory, storage, and virtualization that Citrix depends on. Because problems often originate outside Citrix, this end-to-end view, combined with dependency mapping, lets teams find the true root cause faster and cut mean time to resolution.
Yes. Citrix monitoring reduces downtime by detecting performance degradation early, correlating symptoms to a root cause, and supporting capacity planning and automated remediation. Catching a failing host or a slow logon before users are affected helps teams prevent outages rather than just reacting to them after the impact.