


Troubleshooting the Most Common Citrix Complaints From Remote Workers using XenApp (Virtual Apps) and XenDesktop (VDI): FAQs
A few days ago, we hosted a very well received webinar presented by Barry Schiffer (CTP) from eG’s Benelux team and George Spiers, CTP and real-world Citrix Administrator. They covered key questions and workflows, such as:
 When remote workers complain that Citrix is slow, where do you initially focus your investigations?
- What do you analyze and how do you triage now that there are remote working factors to consider?
- Understanding the most common issues and how to troubleshoot them like slow logons, slow app/desktop sessions, connectivity issues, and more
- How to methodically go about finding the scope, magnitude of impact, and source of the problem?
- Understanding the most common issues and how to troubleshoot them like slow logons, slow app/desktop sessions, connectivity issues, and more
- Investigating issues in the supporting infrastructure (network, AD, virtualization, etc.)
- Troubleshooting with automated and built-for Citrix monitoring tools
A colleague and I were answering questions during the live webinar, and we received a lot of questions. One of the best things about participating in these webinars is the high quality and breadth of questions that we receive from the attendees.
We were able to answer most of the questions during the webinar but there were a few we simply didn’t get to or that needed further research to follow-up. However, since the webinar I have compiled and answered the full set of questions below.
Questions & Answers
- How does eG Enterprise monitoring integrate with Citrix?
- How can I troubleshoot an application launching issue?
- How could I monitor the end-user network, client, etc. in a home office? In Citrix Director and ADM, high latency and ICA RTT could be seen. But every time while talking with the user, they told me “My network is ok I tested it through streaming a video and it runs fine but the Citrix connection is slow.”
- Can eG Enterprise narrow down issues related to the user’s ISP provider?
- With an increase in work from home/anywhere, issues with applications being accessed via a VDI desktop are being amplified with the application backend performance. How far does eG Enterprise go to provide end-to-end performance visibility?
- Does eG Enterprise have visibility into core network switches?
- Do you have insights into Citrix ADC (was NetScaler)?
- Beyond VMware ESX and Microsoft Hyper-V, are there any metrics that can be gathered for other hypervisors like Nutanix native hypervisor?
- What about Citrix Cloud?
- Is there a way to monitor NVIDIA grid card usage?
- Can the eG Enterprise dashboard serve as a productivity monitor as well as tracking latency/connectivity, or do you partner/pair with services that can monitor (remote) workers via the same interface?
- Can you show us a dashboard from where a Citrix engineer can quickly tell where the issue is without going into details?
- I’ve also found issues specific to out-of-date HTML5 clients. Does eG Enterprise alert or report on this?
- Slow logon is one of the most common complaints we face. Are there best practices for troubleshooting and resolving slow logons?
- What is considered a slow Citrix logon? Can we change the settings for what is a slow Citrix logon in the monitoring tool?
- How can one reduce the number of AD policies when you have between 10 and 15 GPOs (Network maps, i.e., settings, desktops settings, etc.)?
- Is there a way to analyze failed logins based on the failed factor (LDAP/RADIUS/2FA/Certificate)?
- WFH is already a challenge for some of my users but coupled with logon, latency, or launch delays it is more frustrating for them. When they were in the office, it was easy to pinpoint a single point of failure but when they are working in their houses… What is the best way to distinguish where is the actual emanation [source] of the bottleneck without getting cussed out on a daily basis?
- How about Citrix in Citrix session? How to optimize this situation?
- Any problems dealing with the desktop screen resolution?
- Voice calls over AVAYA Softphone can have a choppy voice. How can we further optimize voice applications deployment and provide better performing solutions for these applications?
- We experience serious issues with screen sharing using MS Teams within Virtual Desktops. The way this traffic is redirected through Workspace App components installed on a local machine seems to be very problematic. Troubleshooting those issues is another story. Do you have any advice/suggestions for troubleshooting this type of issues? We’ve talked to MS Teams and Citrix (support cases were opened) and “improvements” are coming to the Workspace App but no one knows when that is going to happen.
- Has everyone else seen an uptick in requests for persistent desktops?
- With eG Enterprise, can you generate automated reports like what Citrix EdgeSight (back in the XenApp 6.x days) had where a report is emailed or a dynamic Excel file?
- For the reports, does it require admin/manager to go and get the report? Or, can it be automated to be sent via a scheduled email?
- Is eG Enterprise a cloud-based product or can we deploy it in-house?
- Where is the cloud service offered out of?
- Can eG Enterprise be used with its 100% features in any type of infra (On-Prem, Hybrid [Cloud+On-Prem] and Full Cloud)?
- What is the main benefit that I get, as a Citrix customer, by using eG Enterprise instead of using the monitoring tools provided by Citrix itself? How is this program different from Citrix Director?
- How does your product compare with Citrix Analytics?
- The data analytics that we see in eG Enterprise, is that clientless or does it require a client app at the user end?
- Do you scan or monitor for malware processes on VMs with any type of alerting for admins?
- What about monitoring thresholds triggering alerts to tools like PagerDuty?
- From which user/company size, would it make sense to use products like eG Enterprise? If you have just one data center and not more than 400 concurrent Citrix users, would Director be enough?
- Can you tell us about the licensing model/cost of eG Enterprise?
- Who covers the cloud costs of a trial of your SaaS product?
How does eG Enterprise monitoring integrate with Citrix?
eG Enterprise is a Citrix-Ready solution that works out of the box for Citrix Virtual Apps and Desktops. It doesn’t rely on Citrix Director or Citrix Analytics for performance. It integrates with all the key products in the Citrix stack. Native APIs for CVAD, ADC, StoreFront, etc. are used to monitor the different Citrix technologies.
How can I troubleshoot an application launching issue?
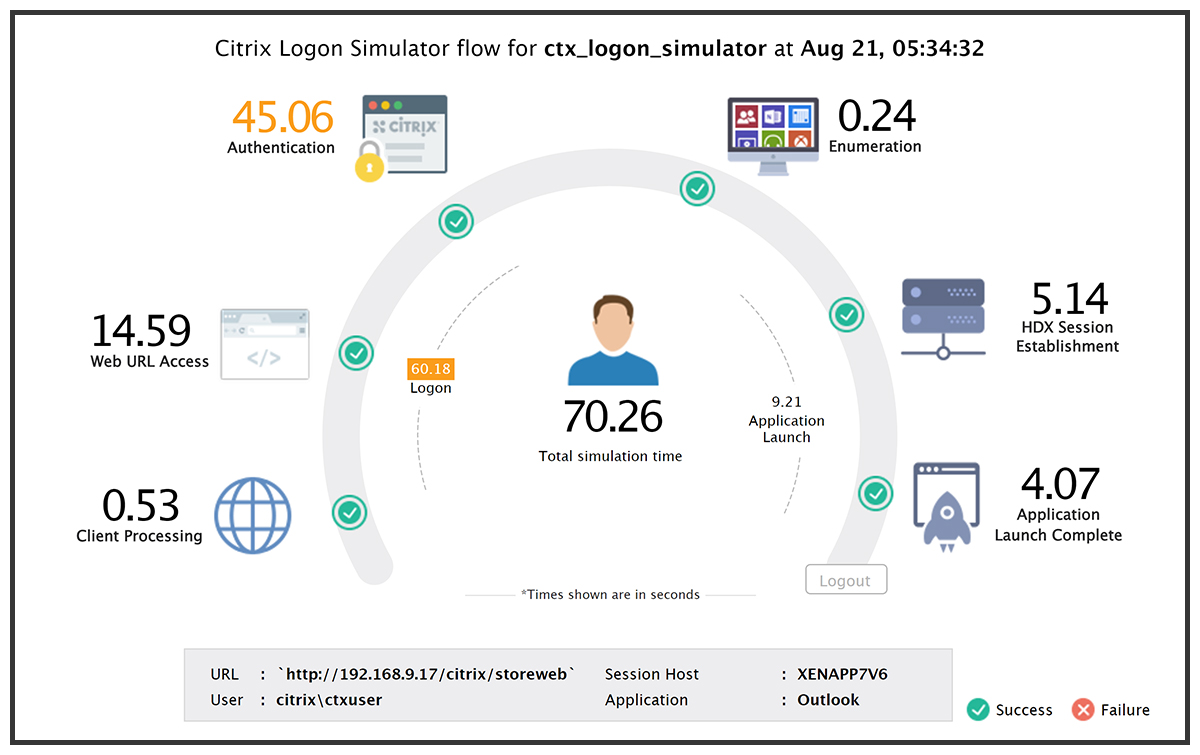 If you are referring to a published application, a lot of admins use logon simulation for Citrix. This can highlight why launching your virtual application is slow: is it due to slow StoreFront access, AD authentication, GPOs, etc.? If you are referring to launching applications inside a virtual desktop, you can use our full-session simulation capability to monitor application launch times. Agents on virtual app servers or virtual desktops also report on actual launch times for applications and can alert you if an application is slow to launch. The agent also reports if there are any crash events occurring when an application is launched or any other type of event that is logged in the Windows OS. There are some details of application launch monitoring included here: Citrix Real Time User Experience Monitoring | eG Innovations.
How could I monitor the end-user network, client, etc. in a home office? In Citrix Director and ADM, high latency and ICA RTT could be seen. But every time while talking with the user, they told me “My network is ok I tested it through streaming a video and it runs fine but the Citrix connection is slow.”
eG Enterprise monitors ICA RTT and also ICA network latency. While ICA RTT is close to the latency that the user notices through a Citrix session, ICA network latency is the latency of the network connection between the terminal in the user’s home and the VDA/VDI that the user is connecting to. These are the two important metrics regarding a user session.
If ICA network latency is high, it means that there is an issue in the user’s connection – either in the home network or with the user’s ISP network. With eG Enterprise, administrators can track these latency metrics without needing to deploy any agents on user terminals.
Streaming isn’t a good test as it is not interactive, and buffering can hide a lot of nasties and it may well be allowing packet drops. Bandwidth and network quality aren’t the same thing. In your case, it looks like bandwidth is adequate, but network latency may be an issue. High latency will impact user experience during interactive sessions – that’s why Citrix admins must monitor both ICA RTT and ICA network latency.
This is also why there are metrics like user connection quality indicator that takes into account multiple (bandwidth, line speed, and latency) metrics and provides a rating of the quality of a user’s connection. To learn more about the Citrix connection quality indicator and how eG Enterprise measures this, see our blog: https://www.eginnovations.com/blog/citrix-connection-quality-indicator-cqi/.
Can eG Enterprise narrow down issues related to the user’s ISP provider?
As explained in our answer to the previous questions, eG Enterprise reports on the network latency between the VDA/VDI and the user’s terminal in their remote location. If the network latency is high for some users but not for all users, clearly the issue is not because of the common Citrix infrastructure. The issue could be due to the network in the user’s home, or their connectivity to the Internet.
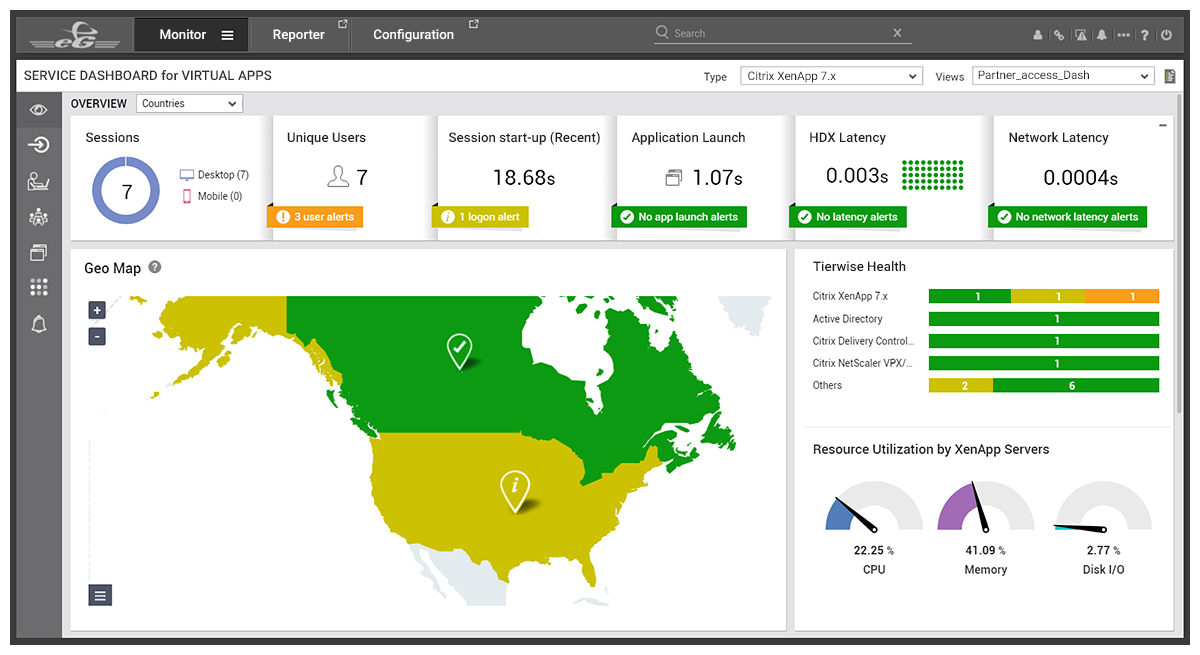
If the user is directly connecting to the Citrix session (not via ADC), you can run traceroute to the user’s terminal from VDA/VDI, right from the eG Enterprise console itself and determine the exact hop that is causing the slowdown.
Geographical maps in the eG Enterprise dashboard map end users to the cities, regions, and countries they are connecting from. The color for a region is based on the performance seen by users in that region. By analyzing the geo maps, admins can determine if there is an issue that is impacting a majority of users in a region. See: What’s New in eG Enterprise v7 (eginnovations.com).
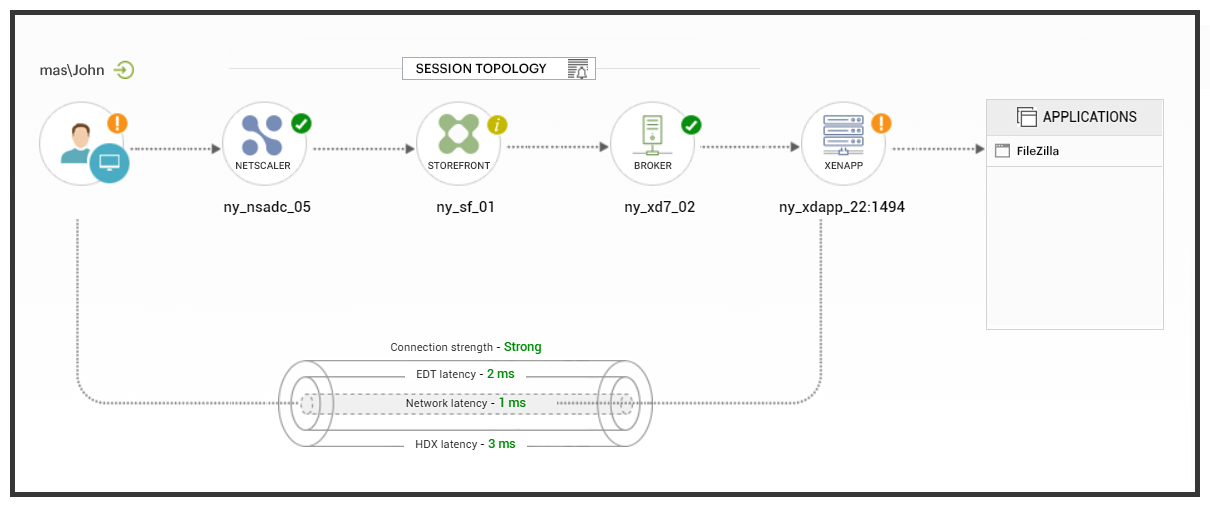
With an increase in work from home/anywhere, issues with applications being accessed via a VDI desktop are being amplified with the application backend performance. How far does eG Enterprise go to provide end-to-end performance visibility?
eG Enterprise provides true end-to-end performance visibility:
- You can measure user experience by using a combination of synthetic and real-user monitoring.
- Agents/agentless monitors in your data center provide visibility into the performance of all the Citrix tiers and the non-Citrix tiers, such as VMware, storage, Active Directory, etc. that are supporting Citrix.
- Unlike many other monitoring tools that have EUC visibility but cannot provide any additional insights into the performance of applications being accessed through Citrix, eG Enterprise also has built-in expertise to track the performance of applications accessed through Citrix. For web applications, you can get code-level visibility. In-depth monitoring is available for enterprise applications, such as SAP, PeopleSoft, Siebel, Microsoft Dynamics, and others. SaaS services, such as Salesforce and Microsoft 365 can also be monitored from the same console.
Does eG Enterprise have visibility into core network switches?
Yes, eG Enterprise supports monitoring of switches and routers using SNMP. It can also collect and analyze Netflow traffic. If you look under the “Network” tab on our 200+ supported technology list https://www.eginnovations.com/product/technologies, you will find the different switches/routers that we support.
Do you have insights into Citrix ADC (was NetScaler)?
 Yes, we collect and present information from ADC as well. The NetScaler documentation is here https://www.eginnovations.com/documentation/Citrix-ADC-VPX-MPX/How-to-Monitor-Citrix-NetScaler-VPX-or-MPX-Using-eG-Enterprise.htm (navigate via the left-hand index) and there is more information here: https://www.eginnovations.com/supported-technologies/citrix-monitoring/netscaler-monitoring (yes, we need to update the name 🙂 ).
We also support alternative popular load balancers, such as F5 and non-VDI infrastructure that often sits behind a load balancer such as Microsoft IIS (https://www.eginnovations.com/supported-technologies/iis-monitoring) and SharePoint (https://www.eginnovations.com/supported-technologies/iis-monitoring).
All the key metrics of NetScaler can be monitored agentless. AppFlow data from ADCs/NetScalers can be exported to eG Enterprise and analyzed as well.
An overview of how eG Enterprise complements Citrix ADM is available here: Citrix NetScaler ADM for Virtual Applications | eG Innovations.
Beyond VMware ESX and Microsoft Hyper-V, are there any metrics that can be gathered for other hypervisors like Nutanix native hypervisor?
Yes, eG Enterprise monitors Nutanix AVH out of the box. The full details of the metrics are available in our documentation: https://www.eginnovations.com/documentation/Nutanix-Acropolis/Introduction-to-Nutanix-Acropolis-Monitoring.htm.
There is a nice blog on our overall Nutanix integration: https://www.eginnovations.com/glossary/nutanix as well as a solution brief: https://www.nutanix.com/content/dam/nutanix/partners/technology-alliances/solution-briefs/nutanix-and-eg-innovations.pdf.
What about Citrix Cloud?
 eG Enterprise monitors Citrix Cloud. The logon simulator enables user logons via Citrix Cloud to be monitored. Using Citrix Cloud APIs, eG Enterprise also has visibility into real-user logon performance in the cloud, machine failures, connection failures, delivery group utilization, license usage information, and much more.
You can read more about the options eG provides to monitor the Citrix Cloud here: Citrix Cloud Deployment Monitoring – White Paper | eG Innovations (https://www.eginnovations.com/supported-technologies/citrix-monitoring/citrix-cloud)
There’s also some information on best practices for monitoring Citrix Cloud (covers cloud connectors) here: Citrix Cloud Monitoring Best Practices in Citrix Workspace | eG Innovations (https://www.eginnovations.com/blog/citrix-cloud-monitoring-best-practices/)
Is there a way to monitor NVIDIA grid card usage?
Yes, vGPU and GPU monitoring is available out of the box; see https://www.eginnovations.com/ blog/citrix-gpu-monitoring/
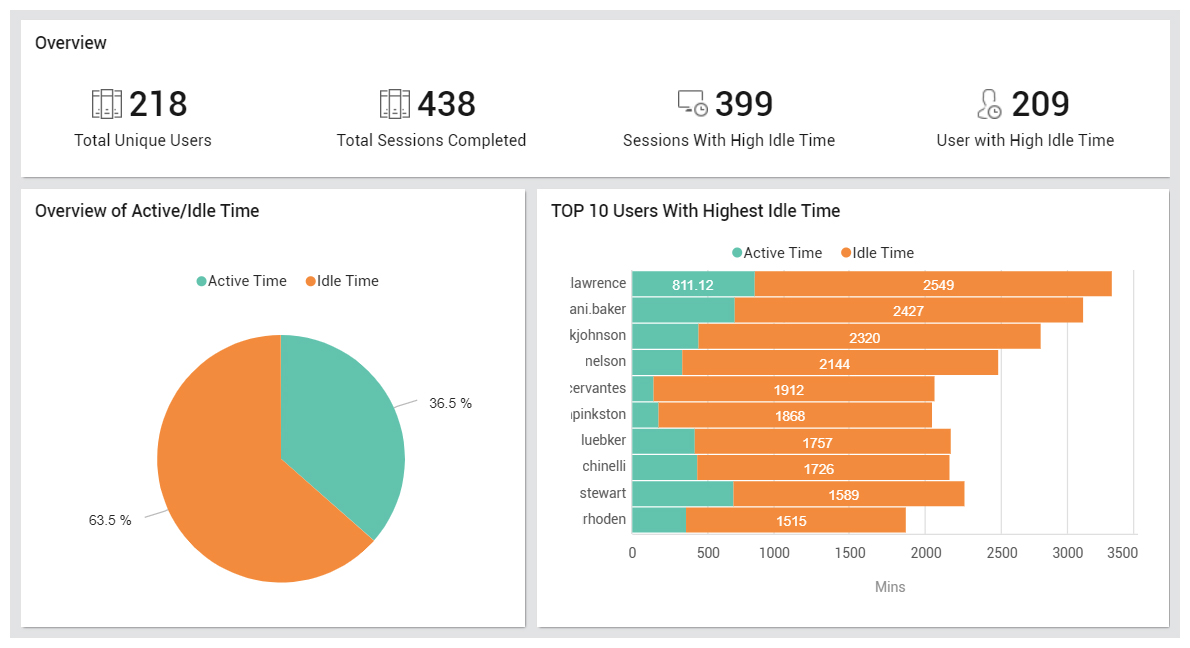
Can the eG Enterprise dashboard serve as a productivity monitor as well as tracking latency/connectivity, or do you partner/pair with services that can monitor (remote) workers via the same interface?
Yes, it can. User productivity is tracked in multiple ways:
- eG Enterprise agents report on total time spent by a user in a session and the time that they were idle in a session. Some of our customers have used eG Enterprise during the pandemic to watch for work patterns amongst employees, such as excessive idle time in a session, actual work hours, working at odd hours, etc.
- Administrators can also track what applications were accessed by users during a session and for how long.
Good monitoring and troubleshooting capabilities are also essential for employees to be productive. A product such as eG Enterprise can improve productivity by identifying where users are hampered by slow performance of IT failures which in turn can reduce end-user frustration. Quantifying application performance and availability are key measures as to whether users are enabled to be productive.
Can you show us a dashboard from where a Citrix engineer can quickly tell where the issue is without going into details?
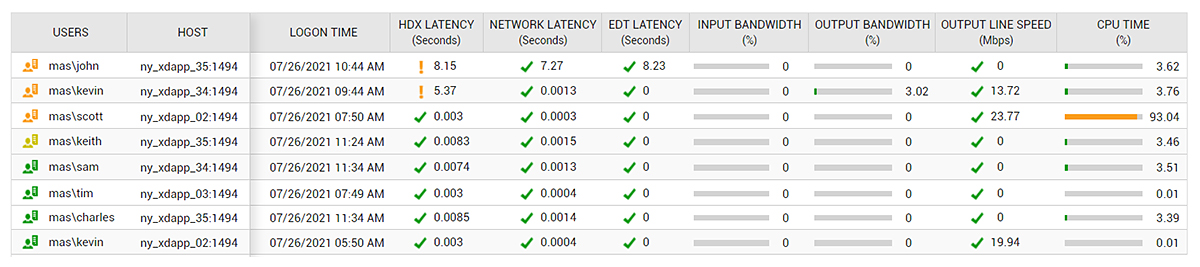
Yes, the user experience dashboard will give you an instant overview of all Citrix sessions and the KPIs for each session. For example, in Figure 5 below, you can quickly see that the user, john, is seeing high HDX latency while the user, scott, is taking up over 90% of CPU time on the server/desktop he is on. A Citrix engineer can instantly see such issues and start working on them proactively.
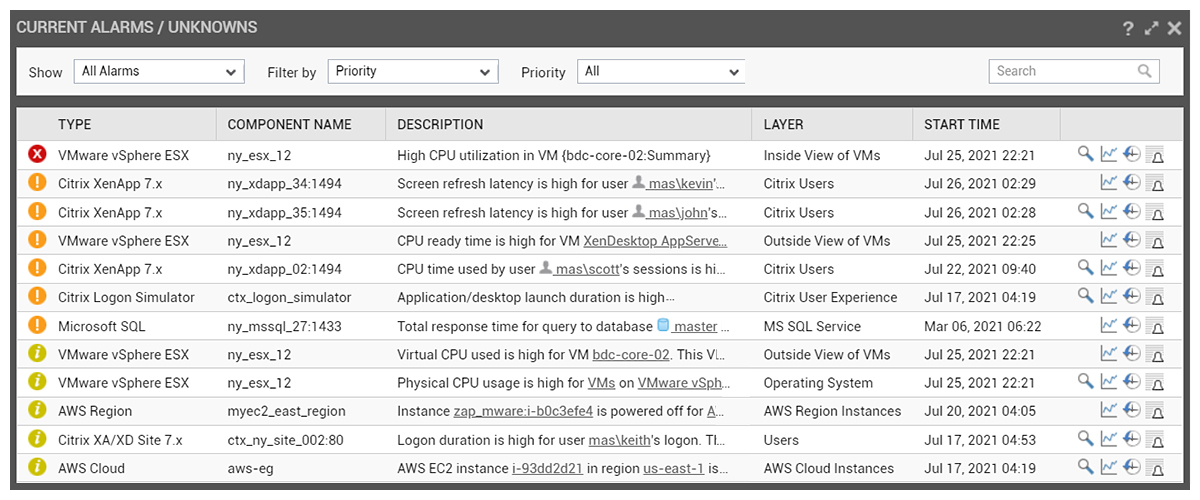
The “Current Alarms Window” will automatically prioritize, and correlate issues based around intelligent root-cause analysis within the AIOps platform. You may like to read more on this: The CURRENT ALARMS Window (eginnovations.com)
I’ve also found issues specific to out-of-date HTML5 clients. Does eG Enterprise alert or report on this?
Yes, indeed. See our earlier blog on reporting on out-of-date receiver versions and its importance here: https://www.eginnovations.com/blog/citrix-receiver/. eG Enterprise also monitors usage by browser type and even reports the active URLs in use on browsers. See https://www.eginnovations.com/documentation/Citrix-XenApp-Servers/Citrix-Users-By-Browsers-Test.htm.
Slow logon is one of the most common complaints we face. Are there best practices for troubleshooting and resolving slow logons?
There is a lot of detail available for monitoring, diagnosing, and resolving slow Citrix logon problems:
 There is an on-demand webinar covering some best practices for easily diagnosing and troubleshooting Citrix logon problems: https://www.eginnovations.com/webinar/best-practices-troubleshooting-slow-citrix-logon
- We also have another recording available, which covers steps to make Citrix Logons faster: https://www.eginnovations.com/webinar/how-to-make-citrix-logons-faster
- Also, see our white paper on best practices for monitoring and troubleshooting Citrix logon issues: https://www.eginnovations.com/white-paper/citrix-logon-issues
What is considered a slow Citrix logon? Can we change the settings for what is a slow Citrix logon in the monitoring tool?
A rule of thumb has been that more than 30 seconds is a slow logon.
At the same time, different organizations in different verticals may want to have different logon time goals. For instance, in healthcare, a doctor may have to logon tens of times in a day, from different devices and a slow logon each time can reduce their productivity. Hence, monitoring tools, such as eG Enterprise allow administrators to configure their logon time goals and will generate alerts when these goals are violated.
How can one reduce the number of AD policies when you have between 10 and 15 GPOs (Network maps, i.e., settings, desktops settings, etc.)?
Using FSLogix could be beneficial. There are also many settings that can be incorporated via Citrix’s WEM (Workspace Environment Management). Either option would be beneficial for improving the GPO logon stage.
Is there a way to analyze failed logins based on the failed factor (LDAP/RADIUS/2FA/Certificate)?
eG Enterprise’s integration with Citrix APIs allows it to differentiate machine failures, user connection failures, unregistered desktop failures, etc. Failure of GPOs is also tracked as part of real user monitoring.
Beyond this, if eG is also used to monitor the AD (Active Directory) components, such as Microsoft AD, ADFS, etc., we can correlate information on errors and performance issues within the authentication stage. Some information on Active Directory monitoring is available here: Active Directory Monitoring and Management | eG Innovations. A few best practices for configuring and monitoring AD to ensure fast Citrix logon times are available here Active Directory Best Practices to Improve Citrix Logon | eG Innovations.
WFH is already a challenge for some of my users but coupled with logon, latency, or launch delays it is more frustrating for them. When they were in the office, it was easy to pinpoint a single point of failure but when they are working in their houses… What is the best way to distinguish where is the actual emanation [source] of the bottleneck without getting cussed out on a daily basis?
One thing eG Enterprise does that some products don’t is that we collect real user data and if there’s an issue, we collect additional diagnostic issues so that you can a) see the BIG picture across all users b) retrospectively see what the users’ actual metrics and experience was. A few other products run scripts which require the user logged in and the session to be still live and if it’s done when an issue is intermittent, it can be very frustrating.
eG Enterprise is also an AIOps platform so the alerts are based on root cause analysis e.g. we’ll tell you whether it’s a database/file server down causing issues for all your users or is it 1,000s of alerts of users having a bad experience.
eG Enterprise includes a User Experience Dashboard that makes it possible for end users themselves to view the performance metrics related to their access to the Citrix/VDI/Terminal server infrastructure. This can help administrators such as yourself avoid end-user calls if they have visibility on service issues/outages.
How about Citrix in Citrix session? How to optimize this situation?
eG Enterprise can monitor Citrix double-hop scenarios where apps are published on to a VDI desktop, etc. And we can certainly monitor the metrics that would identify the bottlenecks and source of issues. Our licensing is per host or user (concurrent or named) and not per user-session. A few other products use per user-session licensing, which makes no sense in a published apps scenario as a VDI user with access to 10 apps would consume 11 licenses!
Citrix has recently updated their advice on optimizing double-hop scenarios: Double hop in Citrix Virtual Apps and Desktops | Citrix Virtual Apps and Desktops 7 2106n
Any problems dealing with the desktop screen resolution?
Historically, Citrix has had challenges with desktop resolution, especially before Microsoft added more access for Citrix to control the resolution (DPI) relatively recently. Since then, the situation has improved.
Consumer monitor technology has evolved rapidly, and it is not unusual to find home monitors that now exceed the limits of Citrix support – their support knowledge base includes details: Support for Monitors Including 4K Resolution and Multi-Monitors (citrix.com).
We fully support monitoring of virtualized GPUs (vGPU), which can be a key factor in screen resolution in Citrix environments: NVIDIA GPU Monitoring Software | eG Innovations
Voice calls over AVAYA Softphone can have a choppy voice. How can we further optimize voice applications deployment and provide better performing solutions for these applications?
There are a number of known issues with AVAYA within Citrix environments and Citrix is continually updating their support knowledge base with best practice configurations, see Voice call over AVAYA Softphone may have a choppy voice or humming sound after multiple users login, while using Receiver for Windows (citrix.com). A product such as eG Enterprise will allow you to survey users and see whether they are on optimal configurations and to identify common factors shared by users having issues e.g. is it per region, receiver type/version, etc.
Our built-in collectors record detailed ICA/HDX/EDT metrics and settings for every single session, and it is usually these parameters where softphone and VOIP-type issues can be alleviated.
Also, you can enable Citrix’s “Audio over UDP Real-time Transport (RTP)” features to benefit products such as Zoom, Teams, and softphones – see Audio features | Citrix Virtual Apps and Desktops service.
We experience serious issues with screen sharing using MS Teams within Virtual Desktops. The way this traffic is redirected through Workspace App components installed on a local machine seems to be very problematic. Troubleshooting those issues is another story. Do you have any advice/suggestions for troubleshooting this type of issues? We’ve talked to MS Teams and Citrix (support cases were opened) and “improvements” are coming to the Workspace App but no one knows when that is going to happen.
Yes, that is a good question! How can the Teams issue with Citrix be resolved? Video issues are a nightmare. Some can see you while others do not. Stuff you can’t see on any dashboard management…
Beyond Citrix, we can supply enterprise application monitoring for applications such as O365, SAP, etc. including Microsoft Teams. For Teams, there are a wealth of metrics and dashboards available: https://www.eginnovations.com/documentation/Microsoft-Teams/Monitoring-Microsoft-Teams.htm and Microsoft Teams Dashboard (eginnovations.com). Teams’ metrics are correlated alongside the information from Citrix and other infrastructure to identify root causes which we incorporate into dashboards and our layer model.
This would give you insights into the common factors shared by the users, who are encountering issues, receiver version, browser version/type, geography, common CVAD servers, etc. We capture the data for every real user session so that you can analyze reported issues retrospectively and across your whole user base (some products rely on script-based, manual after-the-fact debugging).
You should consider enabling Citrix’s “Audio over UDP Real-time Transport (RTP)” features to benefit products such as Zoom, Teams, and softphones – see Audio features | Citrix Virtual Apps and Desktops service.
Has everyone else seen an uptick in requests for persistent desktops?
No, our experts have not noticed such a trend. We certainly see a lot of non-persistent deployments in both Citrix and VMware. eG Enterprise can, of course, monitor both persistent and non-persistent desktops.
With non-persistent desktops, you cannot rely on access to the user’s desktop and script-based actions to investigate further. The monitoring tool must have sufficient metrics to assist with post-mortem diagnosis.
With eG Enterprise, can you generate automated reports like what Citrix EdgeSight (back in the XenApp 6.x days) had where a report is emailed or a dynamic Excel file?
Yes, automated reports can be generated in PDF or CSV format. Reporting is part of the core eG Enterprise product and numerous out-of-the-box reports are included; custom reporting is also supported. You can read more about eG Reporter – The eG Reporter (eginnovations.com).
There is a 3-min video overviewing Reporter here: How To Work With eG Out-of-the-Box Reports – YouTube.
For the reports, does it require admin/manager to go and get the report? Or, can it be automated to be sent via a scheduled email?
Automated emails can be scheduled at the individual user level. Even a read-only user can receive reports automatically.
Is eG Enterprise a cloud-based product or can we deploy it in-house?
You can deploy eG Enterprise either way: on-premises or use our AWS-based SaaS service. More details of our SaaS service for Citrix monitoring are available here https://www.eginnovations.com/product/saas-monitoring, or you could host the manager on a cloud of your choice.
Where is the cloud service offered out of?
 Our SaaS offering is based on AWS (available in multiple regions for compliance). It could be hosted on-premises, or you could choose to deploy on a FedRAMP cloud yourself.
You can read more about AWS (Amazon Web Services) Security and Compliance models and commitments in their Security and Compliance Overview. Our eG Enterprise SaaS offering implements and adheres to the requirements of the AWS Well-Architected framework.
Our SaaS offerings are currently available in several geographic AWS regions, including Australia, Singapore, Europe (Germany), and the USA. Thus, enabling customers to comply with government and industry regulatory requirements, such as the European GDPR, German BDSG, and the Australian Privacy Act. All data is secured within the customers’ AWS region of choice. Additionally, eG Innovations maintains local offices and staff in all our SaaS regions to ensure we can provide consultancy, training, and support within region and on-site, if necessary.
Wherever you choose to locate your eG Manager, eG Enterprise does not and will never collect data from your (our customers’) systems. There is never a data feed going from eG Manager to any outside system unless specifically configured by the customer and we do not incorporate any dubious call-home technologies.
Can eG Enterprise be used with its 100% features in any type of infra (On-Prem, Hybrid [Cloud+On-Prem] and Full Cloud)?
Yes, it can be used in a hybrid environment, cloud, or on-prem. You can also monitor Citrix alongside other Virtualization and Cloud platforms, including Omnissa Horizon, AWS WorkSpaces, Microsoft Azure, and others.
What is the main benefit that I get, as a Citrix customer, by using eG Enterprise instead of using the monitoring tools provided by Citrix itself? How is this program different from Citrix Director?
There are several additional features than Citrix Director:
 The Citrix Director does not provide the range of synthetic monitoring options – logon simulation and full-session simulation – that eG Enterprise offers.
- The Citrix Director mainly focuses on Citrix session metrics. It does not collect KPIs from Citrix StoreFront, WEM, PVS, AppLayering, or even ADCs.
- It does not monitor the infrastructure supporting your Citrix deployment. Hence, you will not be able to easily distinguish between network issues, Citrix issues, and other infrastructure issues on a single screen.
A more detailed analysis of Citrix Director vs. eG Enterprise is available in an earlier blog: https://www.eginnovations.com/blog/citrix-director-monitoring/.
How does your product compare with Citrix Analytics?
George Spiers had reviewed Citrix Analytics and compared it with monitoring tools, such as eG Enterprise in an earlier blog: https://www.eginnovations.com/blog/citrix-analytics-performance/
In short, Citrix Analytics uses metrics collected by Citrix Director for further analysis. So, it has all the limitations that the Citrix Director has. Customers use Citrix Analytics to get an aggregated view of user experience. It is not an end-to-end monitoring, diagnosis, and reporting solution for Citrix deployments like eG Enterprise is.
The data analytics that we see in eG Enterprise, is that clientless or does it require a client app at the user end?
The probes are only installed in the Citrix server infrastructure. No agents need to be deployed on the user endpoints.
There is information about how our manager and agents are architected for security: Secure Monitoring of Open TCP Ports | eG Innovations
Do you scan or monitor for malware processes on VMs with any type of alerting for admins?
As an AIOps platform, we provide auto-baselining – and this means alert thresholds can be set to autotune to “normal” usage on an hour-by-hour, week-by-week, month-by-month (seasonality), and unusual activity, e.g. Doug from Accounts downloading files at 3am or running PowerShell scripts whilst not a failing IT issue would trigger alerts.
We have an eBook available overviewing our AIOps capabilities that includes more on auto-baselining and anomaly detection – AIOps Solutions and Strategies for IT Management | eG Innovations.
What about monitoring thresholds triggering alerts to tools like PagerDuty?
 Service desk integrations are available out of the box, including PagerDuty, ServiceNow, Autotask, and many more: https://www.eginnovations.com/ blog/service-help-desk-automation/
Note: These are tight integrations using APIs from the service desk tools. In general, we would not advise opening support tickets via a dumb email to a system such as Jira or ServiceNow.
We also support raising alerts via email, SMS, and SMTP, as well as to the eG mobile app for both android/iOS (https://www.eginnovations.com/blog/the-eg-enterprise-mobile-app-android/). So, you can get a small-form-factor-friendly view of alerts rather than the web console Barry used in the webinar.
The app provide a full alert console into eG’s pinpointed root cause analysis, so you can avoid alert storms of messages triggered by metrics crossing dumb thresholds in many products.
Regarding thresholds, eG Enterprise is architected and designed around a powerful AIOps platform designed to scale. Patented Root Cause Analysis (RCA) technologies are leveraged to pinpoint and prioritize single underlying issues to the operator, thus avoiding alert storms and distractions from secondary symptoms. Thresholds for key metrics and signals are configured out-of-the-box based on industry standard best practices, thus eliminating the need to manually set and manage thousands of metric thresholds. IT managers can adjust thresholds for metrics based on service level agreements (SLAs). Three levels of thresholds can be set for upper and lower thresholds, allowing for escalation of alerts should a problem worsen in severity. You may like to check out our video: Understanding and Modifying Alarm Policies – YouTube.
For time-varying metrics or metrics that depend on the system configuration (and hence, need to be set specific to each system), eG Enterprise’s machine learning auto-baselining technology is used to enable dynamic thresholds. This technology tracks time of day, day of week behavior of each metric and uses past history to estimate what the upper and lower limits of each metric are likely to be in the future. Administrators can choose the granularity with which they apply this derived intelligence to allow thresholds to be automatically and dynamically fine-tuned.
Minimal expertise is required to configure the solution. If a metric generates too many alerts, administrators have an option to configure “leniency levels” that allow for some degree of variation from the normal thresholds. We’ve also got a 4-min video on YouTube covering thresholds: Understanding and Modifying Thresholds – YouTube.
From which user/company size, would it make sense to use products like eG Enterprise? If you have just one data center and not more than 400 concurrent Citrix users, would Director be enough?
It often depends on how Citrix has been deployed as it could be complex even in a smaller environment with a few hundred users. eG Enterprise is used by customers of all sizes – ranging from few hundred users to 200K users.
Many of our customers use eG Enterprise to monitor infrastructure and applications beyond Citrix so a single console makes sense even in smaller deployments, and of course, many customers prefer a vendor agnostic monitoring solution to avoid vendor lock in and allow flexibility to change or diversify their chose of cloud, VDI, or hypervisor.
We are increasingly seeing Citrix and VMware customers add products such as AVD (was WVD) or AWS WorkSpaces – there are some statistics and data in our recent digital workspace survey – see Digital Workspaces in the New Normal 2021 Survey Report (eginnovations.com).
Can you tell us about the licensing model/cost of eG Enterprise?
https://www.eginnovations.com/documentation/eG-Licensing-Policy/Licensing-FAQ.htm covers most of the FAQs about our licensing policy. eG Enterprise for Citrix VAD is licensed by server host or by named or concurrent user (that’s real and active users, not the list in your Active Directory).
The concurrent user model works well for organizations with shift patterns, e.g., call centers. While the host-based licensing model works well if you are getting a high density of users per host/virtual app server instance, one of the user-based licensing models is better if the user density you are getting in your Citrix infrastructure is low.
We’ve published a transparent page “An Overview of Pricing and Licensing Options for eG Enterprise“ (IT Monitoring Pricing and Costs | eG Innovations) and our licensing FAQs (Frequently Asked Questions) (https://www.eginnovations.com/documentation/eG-Licensing-Policy/Licensing-FAQ.htm) should answer further questions.
You can contact us to get exact pricing for your Citrix infrastructure, but in general, our amortized monitoring cost for a single-pane-of-glass Citrix monitoring solution is less than the cost of a cup of coffee per user per month.
Who covers the cloud costs of a trial of your SaaS product?
For a standard PoC, eG Innovations will cover the costs so that it is a free trial.

eG Enterprise is an Observability solution for Modern IT. Monitor digital workspaces,
web applications, SaaS services, cloud and containers from a single pane of glass.
eG Enterprise is an Observability solution for Modern IT. Monitor digital workspaces,
web applications, SaaS services, cloud and containers from a single pane of glass.
More Information
- You may also be interested in the FAQs from another recent webinar End to End Monitoring of Citrix Infrastructures – FAQs | eG Innovations, which covers further questions around Citrix monitoring.
- We have a series of YouTube shorts, overviewing key components of the eG Enterprise User Interface and features available: How To Videos – YouTube
- Our Free Citrix Logon Simulator for Citrix CVAD (was XenApp and XenDesktop) is available on: Citrix Logon Simulator – Free Logon Simulator | eG Innovations
- Review our Citrix Troubleshooting Guide to solve your most challenging Citrix issues
- You can find out more about our solution’s support for Citrix here: Citrix Monitoring: Built by Citrix Pros for Best Citrix Performance (eginnovations.com)
 Raja Kannan is Head of Technology Services at eG Innovations. Raja’s experience is in End-User Computing, Infrastructure Monitoring, and Application Performance Monitoring (APM).
