Traditional monitoring tracks system health by collecting data such as metrics and logs, this data is checked to see if a system is behaving as expected and alerts are raised if errors or anomalous data values are found. This works well in stable, predictable environments, but modern IT systems are far more complex and dynamic. In distributed architectures like microservices and cloud-native platforms, predefined alerts usually aren’t enough to explain why a failure is happening. To fix an issue, the root-cause of the issue needs to be identified. Monitoring only tells you what is wrong, when it is wrong, while it is observability that tells you how and why something went wrong. Hence, it is essential to understand in detail the comparision between observability vs monitoring.
Traditional monitoring relies on the expertise of human operators to perform root cause analysis when alerts are raised. Observability automates the process of root-cause diagnostics to answer those “why” and “how” questions.
The shift toward observability-driven IT operations is largely driven by the rise of cloud-native environments and microservice architectures, where systems scale automatically, services are highly interconnected, and infrastructure is often ephemeral. In such setups, failures are harder to predict and diagnose with traditional monitoring alone.
As a result, IT operations are increasingly moving toward observability-driven approaches, enabling faster root cause analysis and deeper insight into complex system behavior.
What is IT Monitoring?
IT monitoring is the practice of tracking the health, performance, and availability of systems, applications, and infrastructure. It focuses on detecting known issues by collecting predefined data and triggering alerts when something goes wrong.
How Traditional Monitoring Works
Traditional monitoring relies on predefined thresholds and rules. For example, if CPU usage exceeds 80% or response time becomes too slow, an alert is triggered. These systems are typically dashboard-driven and reactive in nature.
Common Metrics Used in Monitoring
Metrics are numerical measurements with attributes that provide an indication of the health of one aspect of a system. Common metrics measured by monitoring tools for determining application or infrastructure health include:
- CPU and memory usage
- Disk I/O and storage capacity
- Application response time
- Network latency and traffic
- Error rates and uptime
Limitations of Traditional Monitoring Tools
Typical limitations found with traditional monitoring tools include:
- Limited to known failure scenarios
- Poor visibility into complex, distributed systems
- Reactive rather than investigative
- Difficulty identifying root causes across services
- Struggles with dynamic cloud-native environments
What is Observability?
The Three Pillars of Observability

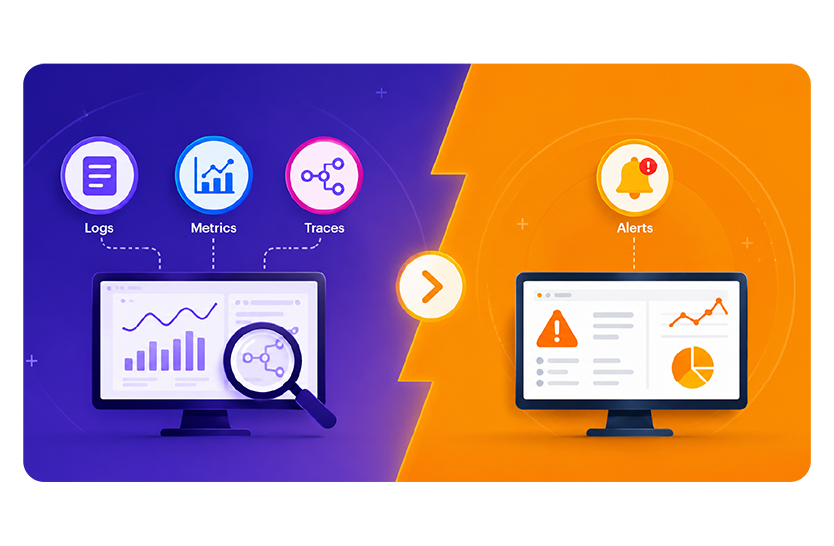
The three pillars of observability in IT are metrics, logs, and traces. These data points combine to provide insights into the health of complex systems and can help diagnose and resolve performance issues and security functions.
- Metrics provide performance data through quantitative measurements.
- Logs offer archived records of historical events and errors of a system.
- (Distributed) Traces follow request or transaction paths to help identify root causes.
You can learn more about the qualities, limitations and behaviors of metrics, logs and traces in our deep dive article: The Three Pillars of Observability: Metrics, Logs and Traces.
How Observability Helps IT Teams Detect Root Causes Faster
Observability helps IT teams find root causes more quickly by giving them a connected view of how a system is behaving, rather than isolated signals. Instead of only showing that something is wrong, it provides the context needed to understand why it is happening.
In traditional monitoring, an alert might tell you that latency has increased or error rates have spiked, but it does not explain where the issue started. Observability changes this by linking metrics, logs, and distributed traces so engineers can follow the full chain of events across services.
Why Observability is Critical for Cloud-Native Applications
Observability is especially important in cloud-native environments where applications are made up of many interconnected microservices. A single user request might pass through several systems, and observability makes it possible to track that request end to end, identifying exactly where delays or failures occur.
Traditional monolithic applications were usually written in one language and had static architectures. Deployment of the application was, by default, manual. Scaling of applications was enabled by increasing the sizing of servers they were deployed on. Software updates were also less frequent – typically, one or two releases or patches in a year.
Modern applications are very different from traditional applications. They use technologies like containers, Kubernetes and microservices, and the different microservices used by an application may involve different programming languages. Deployment of the application components is automated using Infrastructure as Code (IaC) and other orchestration mechanisms. Scaling of applications is mainly done horizontally, by adding new containers and instances, so application topologies have been dynamic as well.
While modern application technologies provide advantages of agility, scalability and allow new capabilities to be introduced quickly, they add significant complexity. Furthermore, application components may be short-lived and the application topology is dynamic. Given the significance of IT applications to businesses today, when failures happen, they cost the business hundreds of thousands of dollars in lost revenue. Hence, organizations are looking to be proactive and need ways to not only know when there is a problem, but they must be able to quickly determine what caused the problem, so it can be rectified quickly. This is where observability comes into its own.
Observability vs Monitoring: Key Differences Explained
Monitoring vs Observability Comparison Table
Traditional monitoring is different from observability in many ways:
| Feature | Monitoring | Observability |
| Data visibility | Focuses on predefined metrics, dashboards, and alerts for known conditions. | Provides broader visibility using metrics, logs, traces, and telemetry across the entire system. |
| Root cause analysis | Identifies that an issue exists but offers limited diagnostic context. | Pinpoints the root-cause of many issues or enables deeper investigation to quickly determine why an issue occurred. |
| Scalability | Works well in stable and predictable static environments. | Designed for complex, distributed, and cloud-native architectures. |
| Automation | Uses rule-based alerts and manually defined thresholds. | Supports intelligent correlation, anomaly detection, and automated analysis. |
| User experience monitoring | Primarily tracks infrastructure and application health. | Offers end-to-end visibility into user journeys and service performance. |
| AI-driven insights | Limited or minimal AI capabilities. | Increasingly incorporates AI and analytics for proactive issue detection and prediction. |
When Monitoring Alone Fails
When monitoring alone fails, it is usually because it only captures predefined metrics and alerts, which are insufficient in complex, distributed systems. It can tell you that something is wrong but not why or where the issue originated. In modern microservices or cloud environments, failures often span multiple services, making root cause analysis difficult. Without deeper context from logs and traces, teams struggle to diagnose issues quickly and restore normal system performance efficiently.
While collecting metrics, logs and traces is important, an observability solution is not just about collecting data. The collected data should be analyzed automatically, using AIOps capabilities. IT teams cannot be expected to sift through millions of metrics manually and repeatedly. Automated analysis using machine learning and AI technologies is an integral function of observability solutions. At the same time, observability solutions must also provide the visualizations – dashboards and reports – that allow IT teams to look for patterns in data sets, cross compare across them and draw meaningful conclusions.
Why Full Stack Observability is Important for Modern Enterprises
Full stack observability refers to the ability to provide insights into the performance and usage of every layer and every tier of the infrastructure, across application types.
Managing Hybrid and Multi-Cloud Infrastructure
Full-stack observability is important when managing hybrid and multi-cloud environments and observability solutions need to ensure that data and signals are collected from every tier whether they be on-prem or spread across different tiers. Broad technology coverage is essential to ensure visibility gaps are eliminated and that the AIOps engine has a comprehensive set of data to analyse to pinpoint the root cause of issues and answer the question “Why has the system failed”.
Learn more about our support for hybrid and multi-cloud environments, see: Monitoring and Troubleshooting Multi-cloud Infrastructures.
We’ve also got a free eBook on all aspects of Observability in the cloud – download it here
Improving Application Performance Across Distributed Systems
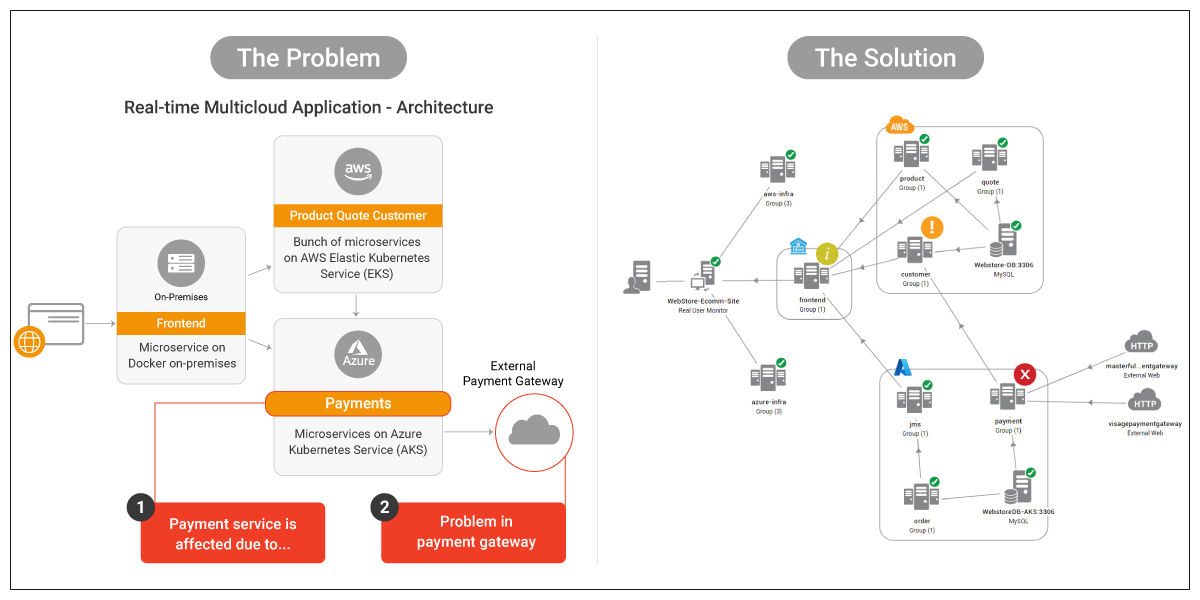
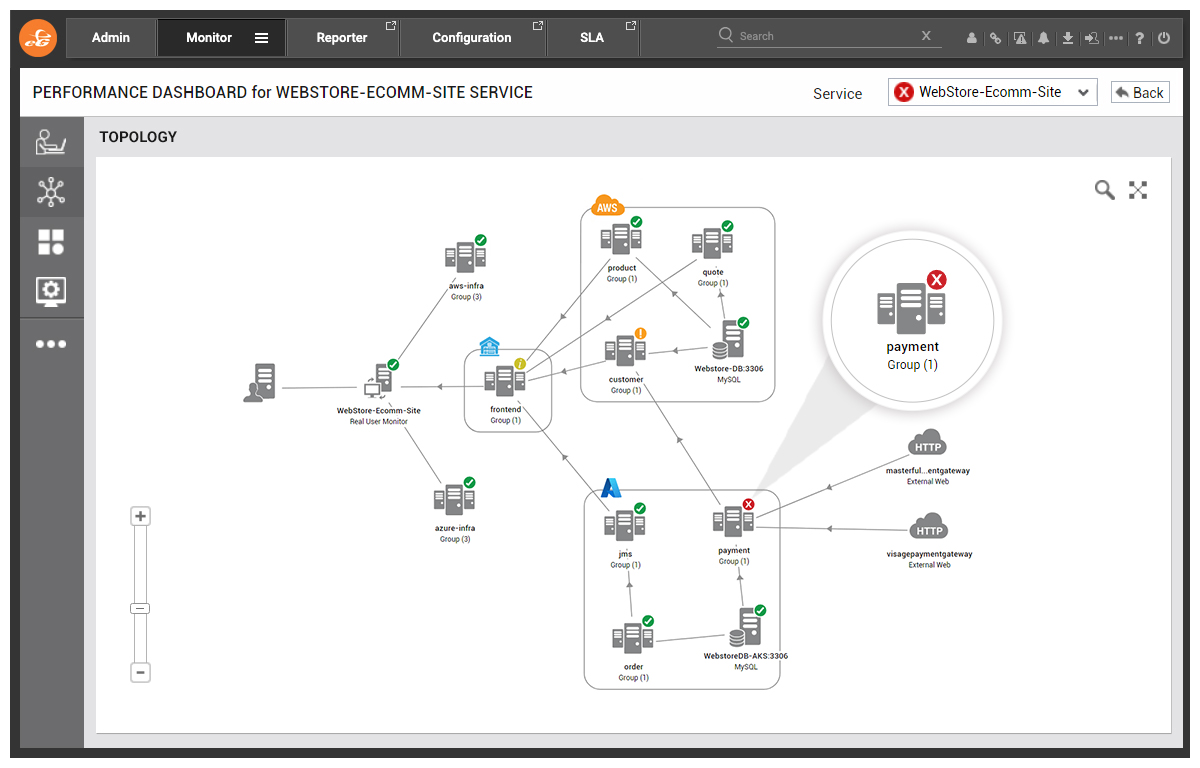
Distributed tracing is a method used in distributed systems to trace the path of an application request as it travels through different services and components – from frontend applications to middleware to backend services and database servers.
In a distributed system, a single request may be processed by multiple microservices. eG Enterprise’s distributed tracing does not require you to make any changes to your application code. Each service records information about the request as it passes through, including timestamps, the name of the service, and any relevant metadata. This creates a trace, which is a step-by-step log of the request’s journey through the system.
Distributed tracing provides visibility into how a request flows through a distributed system and helps identify performance issues, bottlenecks, and errors. eG Enterprise will pinpoint where a request is spending the most time, identify areas for optimization, and troubleshoot issues quickly.
![]()
Reducing Mean Time to Resolution (MTTR)
Automating the root-cause diagnosis of issues avoids the need for manual investigation and ultimately results in a reduction in the MTTR. Full-stack observability means that eG Enterprise can correlate data across applications, infrastructure, cloud services, and user experience layers. By connecting telemetry from the entire stack along with intelligent models of the dependencies (domain expertise) within the stack, the AIOps engine can give accurate diagnostics that pinpoint the root-cause of issues so they can be swiftly resolved.
“We have no more frustrations because now we know where the problem is, and the root cause of issues is detected in minutes. With the eG Enterprise performance monitoring suite we deliver a robust and reliable environment that guarantees maximum uptime and user satisfaction.”
Wilfried Landsheer, Director, Systemat Digital Hub
Real-World Use Cases for Full Stack Observability
The full-stack observability offered by eG Enterprise delivers value by providing end-to-end visibility across modern IT environments. In environments where applications are becoming increasingly distributed, organizations need insights across infrastructure, applications, containers, and user interactions to quickly identify and resolve performance issues.
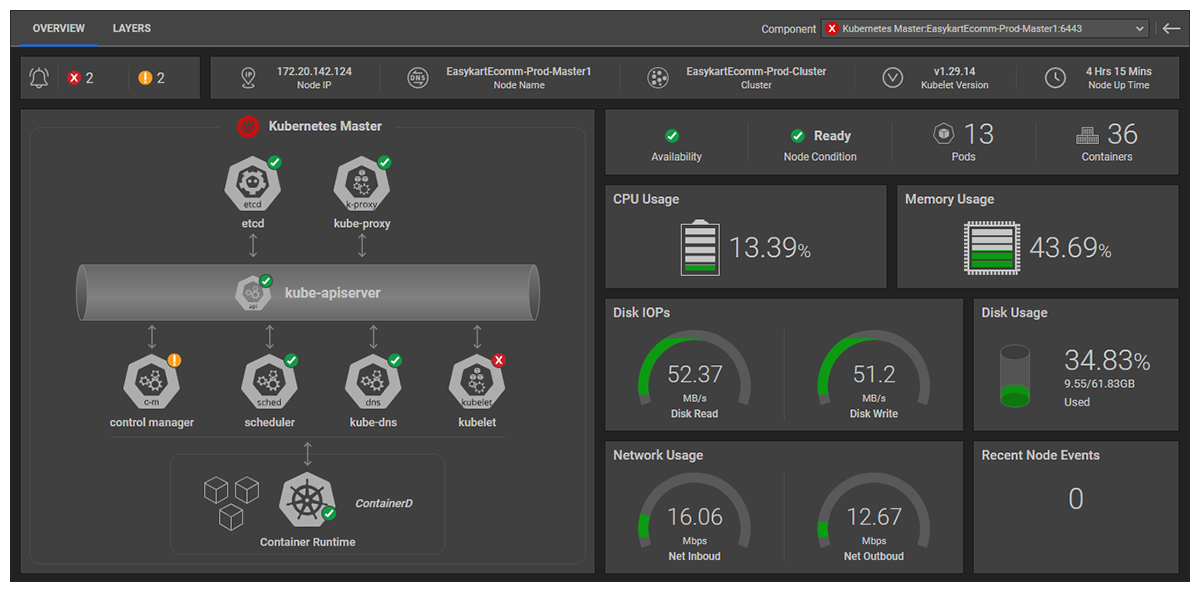
Kubernetes and Container Monitoring
eG Enterprise is commonly used for Kubernetes and Container monitoring. Kubernetes environments are highly dynamic, with containers constantly scaling, moving, and restarting across clusters. Traditional monitoring tools often struggle to track these short-lived components effectively. Full-stack observability provides visibility into container health, resource utilization, cluster performance, and service dependencies, helping teams identify issues before they affect application performance.
Learn more about how eG Enterprise provides Kubernetes and Container Monitoring: Kubernetes Monitoring Tools | eG Innovations.
Microservices Performance Monitoring
Modern applications use microservices architectures where a single transaction may pass through multiple interconnected services. Full-stack observability enables teams to trace requests across services, identify latency bottlenecks, and understand service dependencies. This helps organizations quickly pinpoint performance issues and reduce troubleshooting complexity.
End-User Experience Optimization
Infrastructure health alone does not guarantee a good user experience. Full-stack observability extends visibility to the end-user layer by monitoring application responsiveness, session performance, and digital experience metrics. This allows organizations to understand how users interact with applications and proactively address performance issues before they impact productivity or customer satisfaction.
With both synthetic and real-user monitoring capabilities, an observability solution like eG Enterprise provides insights into user experience data, allowing you to identify issues proactively and improve user experiences with quick feedback.
Key Features to Look for in a Full Stack Observability Platform
Domain expertise
AIOps-enabled technologies and their outcomes are only as good as the built-in domain expertise they include. Domain expertise covers the models of hierarchies and interdependencies between layers and tiers that explain causality. This information helps differentiate root-cause alerts from those pertaining to secondary symptoms. For example, it is the domain understanding that allows the AI to understand an alert from a server running out of CPU capacity is the primary effect causing multiple virtual desktop user alerts for poor session latency.
Choose tools that are purpose-built for the technologies in use, whether that be for Java apps, AVD virtual desktops, network switches or cloud storage.
AI-Powered Root Cause Detection
Many IT organizations operate in silos, with separate teams, often geographically distant, responsible for various parts of the infrastructure and application deployment. Often these teams use different set of tools to monitor the health of individual domains, such as cloud and data center, networking, storage, and others. When a problem occurs, it is essential to be able to point to the relevant tier of the infrastructure and the associated team. This is where Root Cause Analysis (RCA) comes in. Accurate and effective root-cause diagnosis can save organizations hours of time they would otherwise spend in bridge calls and in finger-pointing. Good RCA capability ensures that IT operations teams get a prioritized list of alerts – the highest priority points to the root-cause of problems, while the lowest priority often denotes the effects.
Dependency Mapping
Manually creating topology graphs is challenging. Some administrators may not even be aware of their service topologies. Furthermore, manually discovering these dependencies can be time consuming. At the same time, some dependencies are dynamic – e.g., an application and its VM can move between physical nodes in a virtualization cluster. Hence, to be effective monitoring tools must be smart enough to auto-discover the applications and infrastructure they are to monitor.
Unlike physical topologies and network connectivity, which are simpler to discover, inter-application dependencies are not straightforward to unearth. Many monitoring tools have used network sniffing and network connectivity information to discover application inter-dependencies. These techniques are more challenging in virtualized and containerized environments where inter-application communications can happen within a physical server itself.
eG Enterprise uses embedded domain knowledge to discover application landscapes (for example, in a Citrix deployment, an agent on a Citrix Delivery Controller can map out most of the service topology map because it knows how to determine where the virtual app servers are, what the dependency between a virtual app server and a provisioning server is, etc.). Using application APIs, configuration information and application-specific commands, eG Enterprise precisely discovers application topologies. For dynamic dependencies like VM to physical machine dependencies, the observability solution uses virtualization APIs. The result is easy deployment and configuration of the monitoring system. Manual overrides to the discovered topology are possible, should the auto-discovered information need to be modified.
Unified Infrastructure and Application Visibility
AIOps is only as good as the quality of the data it ingests and the quality of the models it uses to provide contextual understanding. eG Enterprise covers both application and infrastructure components in a single consolidated platform. The relational understanding built into the platform provide the engine with the understanding of the dependencies and causal relationships between applications and the infrastructure on which they run enabling advanced observability features such as root cause diagnostics.

How eG Innovations Delivers Full Stack Observability
eG Innovations delivers full stack observability by combining deep monitoring, intelligent analytics, and automation to provide complete visibility across modern IT environments. This helps organizations understand system behavior end to end and resolve issues faster in complex hybrid and cloud-native architectures.
eG Enterprise is a single-integrated observability solution for cloud, hybrid and on-premises infrastructures. It covers a wide range of technologies – over 650+ common infrastructure and application components out of the box. Built from ground up, eG Enterprise incorporates built-in domain expertise to address different use cases including digital workspaces (Citrix, Omnissa Horizon, Azure Virtual Desktop, etc.), web applications using languages like Java, Microsoft .NET, PHP, Node.js, etc., enterprise applications like SAP and other ERP applications, Siebel and other CRM technologies, and SaaS applications like Microsoft Office 365 and Zoom.
Patented data analytics and AI-technologies built into the system facilitate automatic baselining, alerting and root-cause detection. An overview of the Machine Learning and Statistical Correlation Analysis built-into eG Enterprise are available in our in-depth eBook on AIOps (Artificial Intelligence for IT Operations). It is this set of capabilities that enables eG Enterprise offer great value to organizations across different verticals. See our case studies here.
AI-Driven Performance Analytics
eG Innovations uses AI-driven analytics to process large volumes of performance data and detect anomalies in real time. This helps IT teams identify emerging issues early, predict potential failures, and prioritize incidents based on business impact.2
End-to-End Visibility Across Applications and Infrastructure
The platform provides unified visibility across applications, infrastructure, networks, databases, and cloud environments. By correlating metrics, logs, and user experience data, it eliminates blind spots and helps teams understand how each layer of the stack affects overall performance.
Automated Troubleshooting and Alert Correlation
eG Enterprise offers automatic correlation across tiers using alerts and events to reduce noise and highlight the actual root cause of issues. This automated troubleshooting approach reduces manual effort, speeds up diagnosis, and significantly lowers Mean Time to Resolution (MTTR) in complex environments.
Conclusion
As the complexity of IT environments continues to grow, organizations are accelerating their adoption of modern observability tools. Advances in the AI-technologies these platforms can now leverage is fueling a new generation of capabilities. Thus, extending to automatic remediation of issues. The future of observability is strong with the next generation of tools. As these tools excel at differentiating themselves by the quality of the contextual domain expertise built into their platforms.
A general left-shifting of priorities mean that organizations look to observability beyond monitoring to avert issues. In addition, to holistically and continually optimize IT environments rather than resolve issues after the event. Organizations now recognize the importance of proactive IT operations for ensuring optimal digital experiences and for protecting business continuity.
Want to learn more about eG Enterprise and Observability? Read the solution brief: Observability for Modern IT.
Bottom line
Any industry operating cloud-native, real-time, or large-scale distributed systems benefits from observability. But it’s especially critical where downtime equals financial loss, safety risk, or user churn. You can read more about how eG Enterprise’s observability offers great value to organizations across different verticals. See our case studies here.
eG Enterprise is an Observability solution for Modern IT. Monitor digital workspaces,
web applications, SaaS services, cloud and containers from a single pane of glass.
Frequently Asked Questions
Monitoring focuses on tracking predefined metrics and alerts to tell you when something goes wrong, typically answering “what is happening?” Observability goes further by using metrics, logs, and traces to explain system behavior and answer “why it is happening.” While monitoring is reactive and limited to known issues, observability is exploratory, enabling deeper debugging, root-cause analysis, and better understanding of complex distributed systems.
Full stack observability is important because modern IT environments are highly distributed and interconnected. Applications now span infrastructure, cloud services, containers, databases, APIs, and end-user interfaces, making troubleshooting more complex. Traditional monitoring tools often provide isolated views, making it difficult to understand how issues affect the broader system. Full stack observability delivers visibility across every layer of the technology stack, helping teams detect problems, trace dependencies, and identify root causes faster. This unified approach reduces downtime, improves operational efficiency, enhances user experience, and enables organizations to maintain reliable performance in increasingly dynamic cloud-native environments.
The three pillars of observability in IT are metrics, logs, and traces. These are the outputted sources of signals which observability solutions must process and analyze to infer the internal state of IT systems.
Not really—observability doesn’t replace traditional monitoring; it extends and builds on it. Monitoring is still essential for known problems and baseline system health. You still need alerts for things like CPU spikes, service downtime, or error-rate thresholds. These are predictable conditions where fast, automated detection matters. Observability goes further by helping you handle unknown or complex failures. It lets engineers investigate why something is happening by connecting metrics, logs, and traces across distributed systems. Many modern observability solutions implement AI technologies to assist the process of automated root-cause analysis.
Industries that benefit most from observability are those running complex, distributed, or always-on digital systems, where downtime or performance issues directly impact revenue or user experience.
- Technology & SaaS companies - These teams run microservices, APIs, and cloud-native platforms at scale. Observability helps them debug quickly, reduce downtime, and maintain performance for global users.
- Financial services & fintech - Banks, trading platforms, and payment systems need real-time reliability and strict uptime. Observability helps detect anomalies in transactions, latency spikes, and security issues fast.
- E-commerce & retail -
Online stores rely heavily on uptime and fast page loads. Observability helps track user journeys, checkout failures, and backend bottlenecks that directly affect sales. - Telecommunications - Telecom networks are highly distributed and complex. Observability helps monitor service quality, network performance, and large-scale infrastructure issues.
- Healthcare & life sciences - Hospitals and digital health platforms depend on reliable systems for patient data, diagnostics, and connected devices. Observability improves system reliability and is observability features are often mandated for compliance.
- Media, streaming & gaming - These industries require low latency and high availability. Observability helps monitor streaming quality, server load, and real-time user experience.
 Chandni Verma is a Demand Marketing Manager at eG Innovations, focused on blending strong marketing strategy with hands-on exposure to observability platforms to translate complex concepts into compelling, business-driven narratives. Her cross-functional work with product and engineering teams enables her to create impactful, insight-led content for modern IT audiences.