Server OS Machines - Cloud Test
Server OS Machines are VMs or physical machines based on the Windows server operating system used for delivering applications or hosted shared desktops to users.
This test auto-discovers the Server OS Machines in the control plane and reports the session load on, resource usage of, and current state of each machine. This way, administrators can quickly identify machines that are experiencing heavy load and those that are consuming resources abnormally.
Target of the test : A Citrix Cloud Control Plane
Agent deploying the test : A remote agent
Outputs of the test : One set of results for each server OS machine running in the Citrix Cloud Control Plane
| Parameter | Description |
|---|---|
|
Test Period |
How often should the test be executed. |
|
Host |
The IP address of the host for which this test is to be configured. |
|
Port |
Refers to the port at which the specified host listens to. By default, this is 80. |
|
Customer ID |
When configuring the Citrix Cloud service, you should have created an API client on the cloud, so that any external program can communicate with the cloud. This API client is tied to a customer ID. The Citrix Cloud API requires this customer ID, when calling REST APIs. To determine the customer ID that is mapped to the API client you created, refer to Determining the Customer ID Mapped to an API Client. |
|
Service Principal/Secure Client File Path |
When creating the API client on the cloud, you will be provided with an ID and a Secret for your client. Downloading this information saves a file named serviceprincipal.csv (if you have used Service Principal as an API client) or secureclient.csv (if you have used Secure Client as an API client). The eG agent uses the ID and Secret stored in this file to connect to the Citrix Cloud API. This is why, you should configure this test with the full path to the serviceprincipal.csv or secureclient.csv, as the case may be. Note: Before specifying the path of the secureclient.csv file, make sure that the API client is created and this file is downloaded by a valid Citrix cloud user with Read-only administrator rights to virtual apps/desktops. To know how to create this user on the cloud, refer to Before specifying the path of the serviceprincipal.csv file, make sure that the API client is created by a user with administrator rights to virtual apps/desktops and this file is downloaded by the administrator. To know how to create the Service principal as an API client on the cloud, refer to |
|
Region Endpoint |
By default, US is chosen from this list indicating that this test will report metrics for those organizations whose users and resources are located in the United States region. Sometimes, the eG agent may collect the required metrics with a minor time delay due to the users and resources being monitored are in a different region. To avoid such time delays and to ensure end-user proximity and offer the best user experience, administrators are allowed to change the region based on where most of the users and resources are located. For instance, if the users and resources are located in the Asia-Pacific South region or approximately nearer to the Asia-Pacific South region, then, administrators need to choose 'AP-S' from this list. However, from this list, administrators are required to choose only the region that they had chosen when they signed in for the first time after on-boarding their organization to the target Citrix Cloud. |
|
Report by Delivery Group |
By default, this flag is set to Yes indicating that the individual descriptors of this test - i.e., the machine names - are listed under the delivery groups that they belong to. however, if you do not want this test to list the machine names under the delivery groups, set this flag to No. |
|
Proxy Host and Proxy Port |
If the Citrix Cloud Connector communicates with the Citrix Cloud via a proxy, then, you also need to configure the eG agent on the connector with the proxy server details. This will enable the eG agent to connect to the Citrix cloud without a glitch, and pull metrics. To facilitate this communication. do the following:
By default, both these parameters are set to none, indicating that the eG agent does not communicate with the Citrix Cloud via a proxy. Note:
|
|
DD Frequency |
Refers to the frequency with which detailed diagnosis measures are to be generated for this test. The default is 1:1. This indicates that, by default, detailed measures will be generated every time this test runs, and also every time the test detects a problem. You can modify this frequency, if you so desire. Also, if you intend to disable the detailed diagnosis capability for this test, you can do so by specifying none against DD frequency. |
|
Detailed Diagnosis |
To make diagnosis more efficient and accurate, the eG Enterprise embeds an optional detailed diagnostic capability. With this capability, the eG agents can be configured to run detailed, more elaborate tests as and when specific problems are detected. To enable the detailed diagnosis capability of this test for a particular server, choose the On option. To disable the capability, click on the Off option. The option to selectively enable/disable the detailed diagnosis capability will be available only if the following conditions are fulfilled:
|
 icon provided at the right corner of that browser.
 | Measurement | Description | Measurement Unit | Interpretation | ||||||||||||||||||||||
|---|---|---|---|---|---|---|---|---|---|---|---|---|---|---|---|---|---|---|---|---|---|---|---|---|---|
|
Power state |
Indicates the current power state of this server OS machine. |
|
The values this measure can report and their corresponding numeric values are listed in then table below:
Using the detailed diagnosis of the Power state measure you can view the complete configuration details of the server OS machine. Note: By default, this measure reports the Measure Values in the table above to indicate the power state of a server OS machine. However, in the graph of this measure, the same will be represented using the corresponding numeric equivalents only. |
||||||||||||||||||||||
|
Maintenance mode |
Indicates whether/not this machine is in the maintenance mode currently. |
|
The values this measure can report and their corresponding numeric values are listed in then table below:
Note: By default, this measure reports the Measure Values in the table above to indicate whether/not a server OS machine is in the maintenance mode. However, in the graph of this measure, the same will be represented using the corresponding numeric equivalents only. |
||||||||||||||||||||||
|
Pending image update |
Indicates whether/not image updates are pending on this machine. |
|
The values this measure can report and their corresponding numeric values are listed in then table below:
Note: By default, this measure reports the Measure Values in the table above to indicate whether/not image updates are pending on this server OS machine. However, in the graph of this measure, the same will be represented using the corresponding numeric equivalents only. |
||||||||||||||||||||||
|
Is this physical machine? |
Indicates whether this server OS machine is a physical or virtual machine. |
|
The values this measure can report and their corresponding numeric values are listed in then table below:
Note: By default, this measure reports the Measure Values in the table above to indicate whether/not a server OS machine is a physical machine. However, in the graph of this measure, the same will be represented using the corresponding numeric equivalents only. |
||||||||||||||||||||||
|
Sessions |
Indicates the total number of user sessions on this server OS machine. |
Number |
This is a good indicator of the current session load on a server OS machine. Compare the value of this measure across machines to know which machine is overloaded with sessions. |
||||||||||||||||||||||
|
Load evaluator index |
Indicates the load evaluator index of this machine. |
Percent |
A server’s load index may be the aggregate of:
It is designed to indicate how suitable a XenApp Worker is to receive a new user session. It is the Delivery Controller’s responsibility to calculate the load index based on the aggregate of the normalized load rule indexes generated by the various load rules. As only the Delivery Controller can determine the session load, a server’s overall load index is calculated on the Delivery Controller and not the Virtual Delivery Agent. By comparing the value of this measure across server OS machines, you can figure out whether or not load is uniformly balanced across all servers in the site. |
||||||||||||||||||||||
|
CPU |
Indicates the CPU load evaluator index of this server OS machine. |
Percent |
A high value is indicative of excessive CPU usage by the machine over time. |
||||||||||||||||||||||
|
Memory |
Indicates the memory load evaluator index of this server OS machine. |
Percent |
A high value is indicative of excessive memory usage by the machine over time. |
||||||||||||||||||||||
|
Disk |
Indicates the disk load evaluator index of this server OS machine. |
Percent |
A high value is indicative of excessive disk usage by the machine over time. |
||||||||||||||||||||||
|
Session count |
Indicates the session count load evaluator index of this server OS machine. |
Percent |
A high value indicates that the machine has been consistently handling many user sessions. |
||||||||||||||||||||||
|
Registration state |
Indicates whether this server OS machine is registered or not. |
|
The values this measure can report and their corresponding numeric values are listed in then table below:
Note: By default, this measure reports the Measure Values in the table above to indicate whether/not each machine is registered or not. However, in the graph of this measure, the same will be represented using the corresponding numeric equivalents only. |
||||||||||||||||||||||
|
Maintenance mode enabled machines |
Indicates the number of machines in this delivery group for which maintenance mode has been enabled. |
Number |
This measure will appear only when the Report by Delivery Group parameter is set to Yes. |
||||||||||||||||||||||
|
Percentage of maintenance mode enabled machines |
Indicates the percentage of machines in this delivery group for which maintenance mode has been enabled. |
Percent |
This measure will appear only when the Report by Delivery Group parameter is set to Yes. |
||||||||||||||||||||||
|
Powered on machines |
Indicates the number of machines in this delivery group that are currently powered on. |
Number |
Use the detailed diagnosis of this measure, if enabled, to know which machines are currently powered on. |
||||||||||||||||||||||
|
Powered off machines |
Indicates the number of machines in this delivery group that are currently powered off. |
Number |
Use the detailed diagnosis of this measure, if enabled, to know which machines are currently in the powered off. |
||||||||||||||||||||||
|
Suspended machines |
Indicates the number of machines in this delivery group that are currently in a suspended state. |
Number |
This measure will appear only when the Report by Delivery Group parameter is set to Yes. A high count may indicate capacity or power configuration issues. |
||||||||||||||||||||||
|
Unavailable machines |
Indicates the number of machines in this delivery group that are currently unavailable to accept user sessions. |
Number |
This measure will appear only when the Report by Delivery Group parameter is set to Yes. A high value may indicate connectivity issues, failed services, or power management problems, which can lead to capacity shortages and user login failures. |
||||||||||||||||||||||
|
Resuming machines |
Indicates the number of machines that are currently transitioning from a suspended state back to an active state so they can host sessions. |
Number |
This measure will appear only when the Report by Delivery Group parameter is set to Yes. A high number for a prolonged time suggests slow power operations or resource constraints in underlying hosts, potentially delaying session availability. |
||||||||||||||||||||||
|
Unmanaged machines |
Indicates the number of unmanaged machines in this delivery group. |
Number |
This measure will appear only when the Report by Delivery Group parameter is set to Yes. Unmanaged machines require manual intervention for power operations. A high count reduces auto-scaling benefits and can increase administrative overhead. |
||||||||||||||||||||||
|
Total machines |
Indicates the total number of machines configured in this delivery group. |
Number |
This measure will appear only when the Report by Delivery Group parameter is set to Yes. |
||||||||||||||||||||||
|
Unregistered machines |
Indicates the number of machines that are not currently registered with the Citrix Delivery Controller. |
Number |
This measure will appear only when the Report by Delivery Group parameter is set to Yes. Unregistered machines cannot broker sessions. A spike here often points to machine provisioning failures, VDA issues, network problems, or licensing failures. Use the detailed diagnosis for more details on unregistered machines. |
||||||||||||||||||||||
|
Percentage of unregistered machines |
Indicates the percentage of machines that are not registered with the Delivery Controller. |
Percent |
This measure will appear only when the Report by Delivery Group parameter is set to Yes. Higher percentages are critical and require immediate action to avoid session brokering failures and widespread service disruption. |
Using the detailed diagnosis of the Power state measure you can view the details of the server OS machine such as the IP address, DNS name, OS of the machine, the server hosting the machine, and the current status of that machine.
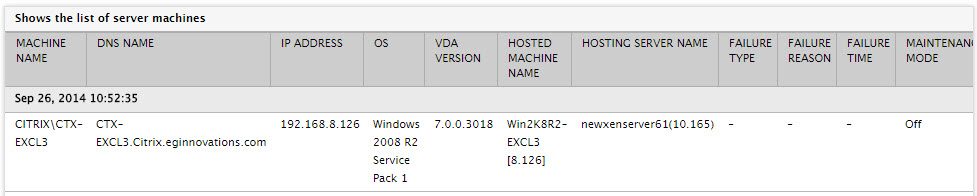
Figure 1 : The detailed diagnosis of the Power state measure