Delivery Groups Test
With the help of this test, you can determine the maintenance mode of each delivery group managed by the monitored broker, and track the usage of desktops within each group. Unregistered desktops, CPU-intensive desktops, disconnected desktops, and desktops available to users, which are managed by this broker, can thus be quickly and accurately isolated.
Target of the test : Citrix Delivery Controller 7.x
Agent deploying the test : An internal agent
Outputs of the test : One set of results for each delivery group that is configured with the Delivery Controller 7.
| Parameter | Description |
|---|---|
|
Test Period |
How often should the test be executed. |
|
Host |
The IP address of the host for which this test is to be configured. |
|
Port |
Refers to the port at which the specified host listens to. By default, this is 80. |
|
Username |
In order to monitor the target Delivery Controller 7, eG requires a special user with the following privileges;
The steps for assigning such privileges to a user are discussed in the Pre-requisites for monitoring the Citrix Delivery Controller 7.x. Specify the name of such a user, here. |
|
Password |
Specify the password for the user specified in the Username text box, here. |
|
Confirm Password |
Confirm the Password by retyping it here. |
|
Domain |
Here, specify the domain to which the user specified in the Username text box belongs to. |
|
Report by Machine Type |
By default, this flag is set to Yes indicating that the individual descriptors of this test - i.e., the delivery groups- are classified based on their machine type; in other words, the delivery groups will be listed either under Server OS Machines or Desktop OS Machines based on their machine type. If you do not want to group the delivery groups based on their machine types, set this flag to No. |
|
Show Available Machines DD |
By default, this flag is set to No. This implies that by default, detailed metrics will not be available for the Available machines measure of this test. To enable detailed diagnosis for this measure, you can set this flag to Yes. In this case, you will be able to view the complete details of all machines that are currently available in each delivery group managed by the broker. |
|
Show Registered Machines DD |
By default, this flag is set to No. This implies that by default, detailed metrics will not be available for Registered machines measure of this test. To enable detailed diagnosis for this measure, you can set this flag to Yes. In this case, you will be able to view the complete details of the machines (in each delivery group) that are currently registered with the broker being monitored. |
|
Show Powered On Machines DD |
By default, this flag is set to No. This implies that by default, detailed metrics will not be available for Powered on machines measure of this test. To enable detailed diagnosis for this measure, you can set this flag to Yes. In this case, you will be able to view the complete details of the powered on machines in each delivery group that is managed by the broker. |
|
Detailed Diagnosis |
To make diagnosis more efficient and accurate, the eG Enterprise embeds an optional detailed diagnostic capability. With this capability, the eG agents can be configured to run detailed, more elaborate tests as and when specific problems are detected. To enable the detailed diagnosis capability of this test for a particular server, choose the On option. To disable the capability, click on the Off option. The option to selectively enable/disable the detailed diagnosis capability will be available only if the following conditions are fulfilled:
|
| Measurement | Description | Measurement Unit | Interpretation | ||||||
|---|---|---|---|---|---|---|---|---|---|
|
Is delivery group available? |
Indicates whether this delivery group is available or not. |
|
This measure reports the value Yes if a delivery group is available, and reports No if it is not available. The numeric values that correspond to the above-mentioned measure values are as follows:
Note: By default, this measure reports the above-mentioned Measure Values while indicating the availability of the delivery group. However, in the graph of this measure, the same will be represented using the numeric equivalents – 1 and 0 only. The detailed diagnosis of this measure if enabled, lists the name of the delivery group, the description, the zone to which the group belongs, the desktop kind, whether Secure ICA is required, the number of sessions supported, whether the machine needs to be shut down after use, Powered on status of the machine if user is assigned, Powered on status of the machine during peak period if user is assigned , the published name of the machine, the delivery type, and the AppDisk name. |
||||||
|
Is delivery group in maintenance mode? |
Indicates whether this delivery group is in a maintenance mode or not. |
|
Delivery groups are typically put on maintenance mode, if the connections to the machines within the group are to be temporarily stopped so that maintenance tasks are carried out. XenDesktop has no control over delivery groups that are in maintenance mode. No user can log on to a machine in this state. This measure reports the value Yes if a delivery group is in the maintenance mode, and reports No if it is not. The numeric values that correspond to the above-mentioned Measure Values are as follows:
Note: By default, this measure reports the above-mentioned Measure Values while indicating the maintenance status of the desktop group. However, in the graph of this measure, the same will represent the maintenance modes using the numeric equivalents – 1 and 0 only. |
||||||
|
Total machines |
Indicates the total number of machines in this group. |
Number |
|
||||||
|
Available machines |
Indicates the number of machines in this delivery group that are available for a new user to connect to. |
Number |
Ideally, this value should be high. The detailed diagnosis of this measure if enabled, will reveal the complete details of the available desktops, such as, the desktop name, IP address, the desktop type, the catalog to which the desktop belongs, the hosting server on which the desktop operates, etc. |
||||||
|
Used machines |
Indicates the number of machines in this group that are currently used by users. |
Number |
The detailed diagnosis of this measure provides complete details of the machines in use such as the machine name, the IP address, the delivery group and catalog to which it belongs, the operating system it runs on and the version of the OS, the hypervisor to which the machine is connected, the user accessing the session, the name of the DNS server with which it communicates, and the machine type - whether Private or Shared, the name of the controller, the location of the changes made by the user, the provisioning type of the machine, the applications that are published on the machine etc. |
||||||
|
Percentage of used machines |
Indicates the percentage of machines in this group that are currently in use by users. |
Percent |
Ideally, the value of this measure should be low. A value close to 100% indicates that the delivery group is about to run out of free machines. Owing to the absence of unused machines, other users who have been assigned to this delivery group will be denied access to the group upon login. Moreover, high usage of a delivery group may also drain the corresponding hosting infrastructure of its physical and virtual resources. |
||||||
|
Disconnected machines |
Indicates the number of machines that are disconnected from this delivery group. |
Number |
The detailed diagnosis of this measure will reveal the complete details of the disconnected machines, such as, the machine name, IP address, OS type, OS version, the desktop type, the delivery group to which the machine belongs, the catalog to which the machine belongs, the hosting server on which the machine operates, the hypervisor connection, the name of the controller, location of the changes made by the user, provisioning type of this machine etc. |
||||||
|
Machines in preparing state |
Indicates the number of machines in this group that are currently preparing sessions for users. |
Number |
|
||||||
|
Disk image out of date |
Indicates the number of machines managed by this delivery group for which the disk image is outdated. |
Number |
It is necessary to update a base virtual disk image over its lifecycle so that the image contains the most current software and patches. Updates can be made manually, or the update process can be automated using virtual disk Update Management features. Use the detailed diagnosis of this measure to know which machines will have to be updated with the latest software fixes and patches. |
||||||
|
Machines in maintenance mode |
Indicates the number of machines in this group that are currently under maintenance. |
Number |
Use the detailed diagnosis of this measure to know which machines are in maintenance mode currently. |
||||||
|
Registered machines |
Indicates the number of machines that are currently registered with this delivery group. |
Number |
Use the detailed diagnosis of this measure to know which machines are currently registered with the broker. |
||||||
|
Unregistered machines |
Indicates the number of machines that are configured in this delivery group but are in an unregistered state with this broker. |
Number |
|
||||||
|
Machines in agent error state |
Indicates the number of machines that are in an AgentError state in this delivery group. |
Number |
|
||||||
|
Never registered machines |
Indicates the number of machines that are not registered properly with the broker although they are configured in this delivery group. |
Number |
|
||||||
|
High CPU machines |
Indicates the number of machines managed by this delivery group that are currently consuming CPU resources excessively. |
Number |
A low value is desired for this measure. Use the detailed diagnosis of this measure to know which machines are running CPU-intensive applications. |
||||||
|
High latency machines |
Indicates the number of machines managed by this delivery group that are currently experiencing high network latencies. |
Number |
A low value is desired for this measure. Use the detailed diagnosis of this measure to know which machines are experiencing high latencies. |
||||||
|
Machines with high profile load time |
Indicates the number of machines managed by this delivery group that are currently taking too long a time to load profiles. |
Number |
A low value is desired for this measure. Use the detailed diagnosis of this measure to know which machines are facing issues when loading profiles. |
||||||
|
Powered on machines |
Indicates the number of machines in this desktop group that are currently powered on. |
Number |
Use the detailed diagnosis of this measure to know which machines are currently powered on. |
||||||
|
Machines with suspended power state |
Indicates the number of machines in this delivery group that are currently in the Suspended state. |
Number |
Use the detailed diagnosis of this measure to know which machines are currently in the Suspended state. |
||||||
|
Powered off machines |
Indicates the number of machines in this delivery group that are currently powered off. |
Number |
Use the detailed diagnosis of this measure to know which machines are currently in the powered off. |
||||||
|
Machines with unknown power state |
Indicates the number of machines in the following power states:
|
Number |
A low value is desired for this measure. The detailed diagnosis of this measure will reveal the complete details of the unavailable machines, such as, the machine name, IP address, the machine type, the delivery group and catalog to which the machine belongs, the hosting server on which the machine operates, the name of the hypervisor and the controller on which the machine operates, the user who is active on the session, the location at which the changes made by the user is stored, the provision type of the machine, and the application published on the machine, if the machine is a XenApp server. |
||||||
|
Machines with pending power actions |
Indicates the number of machines in this delivery group on which the power action is pending. |
|
|
||||||
|
Machines with connection failed |
Indicates the number of machines in this group to which the last connection attempt failed.
|
Number |
A low value is desired for this measure. Use the detailed diagnosis of this measure to know which machines could not be connected to. |
||||||
|
Machines with connection failed recently |
Indicates the number of machines in this group to which the last connection attempt failed during the last measurement period. |
Number |
|
||||||
|
Machines deregistered |
Indicates the number of machines in this group that are deregistered from this broker. |
Number |
The detailed diagnosis of this measure if enabled, lists the name of the machine, IP address, OS type and version, the delivery group and catalog to which the machine belongs, the desktop kind, the hosting server on which the machine operates, the hypervisor connection, the user who is currently accessing the session, name of the controller, the location of the changes made by the user, provisioning type, the applications published on the machine if the machine is a XenApp, the reason for deregistration of the machine and the actual time of deregistration etc. |
||||||
|
Machines deregistered recently |
Indicates the number of machines in this group that deregistered from this broker during the last measurement period. |
Number |
The detailed diagnosis of this measure if enabled, lists the name of the machine, IP address, OS type and version, the delivery group and catalog to which the machine belongs, the desktop kind, the hosting server on which the machine operates, the hypervisor connection, the user who is currently accessing the session, name of the controller, the location of the changes made by the user, provisioning type, the applications published on the machine if the machine is a XenApp, the reason for the machine to be deregistered from the broker, the time of deregistration etc. |
||||||
|
Machines with errors |
Indicates the number of machines on which errors were detected. |
Number |
|
||||||
|
Machines found recently with errors |
Indicates the machines on which errors were detected during the last measurement period. |
Number |
|
||||||
|
Machines available in idle state, outside peak hours |
Indicates the number of machines in this group that should be available in idle state, outside peak hours. |
Number |
The value of this measure is governed by the OffPeakBufferSizePercentand PeakHours variables. The OffPeakBufferSizePercent is set with the PowerShell cmdlet: Set-BrokerDesktopGroup ThePeakHours variable can be set using the Citrix Studio. Depending upon when the machines in the group are used the least and how many machines are used on an average during that period, you can tweak the above-mentioned variables. |
||||||
|
Machines available in idle state, in peak hours |
Indicates the number of machines in this group that should be available in idle state, during peak hours. |
Number |
The value of this measure is governed by the PeakBufferSizePercent and PeakHours variables. The PeakBufferSizePercent is set with the PowerShell cmdlet: Set-BrokerDesktopGroup. The PeakHours variable can be set using the Citrix Studio. Depending upon when the machines in the group are used the maximum and how many machines are used on an average during that period, you can tweak the above-mentioned variables. The goal is to make sure that there is no loss of productivity during peak hours due to the lack of sufficient idle machines. |
||||||
|
Total sessions |
Indicates the total number of sessions currently active on this delivery group. |
Number |
|
||||||
|
Total applications |
Indicates the total number of applications deployed on machines in this delivery group. |
Number |
|
||||||
|
Is added machine turned-on? |
Indicates whether/not machines should be automatically powered-on when being added to this group. |
|
The values that this measure reports and the numeric values that correspond to them are as follows:
Note: By default, this measure reports the above-mentioned Measure Values while indicating whether/not the machines are to be powered-on when being added to this group. However, in the graph of this measure, the same will be represented using the numeric equivalents only. |
||||||
|
Unused machines |
Indicates the number of machines in this delivery group that are managing machines but are not used by any user currently. |
Number |
The detailed diagnosis of this measure provides complete details of the machines that are unused such as the machine name, the IP address, the delivery group and catalog to which it belongs, the operating system it runs on and the version of the OS, the hypervisor to which the machine is connected, the name of the DNS server with which it communicates, and the machine type - whether Private or Shared, the name of the controller, the location of the changes made by the user, the provisioning type of the machine, the applications that are published on the machine etc. |
||||||
|
Machines with unmanaged power state |
Indicates the number of machines in this delivery group that are in an unmanaged power state currently. |
Number |
If machines are not power-managed by Citrix, then their Power state becomes 'unmanaged'. The Power management feature of Citrix allows you to only start and stop certain machines during certain periods. For example, you may have a delivery group of desktops for users that work normal business hours. After 5pm, and as long as the user has been disconnected for a short period of time, the machine could be powered off automatically to reduce resource cost. If this measure reports a non-zero value, then you can use the detailed diagnosis of the measure to know which machines do not have the Power management feature enabled. |
The detailed diagnosis of the Is delivery group available? measure lists the name of the delivery group, the description, the zone to which the group belongs, the desktop kind, whether Secure ICA is required, the number of sessions supported, whether the machine needs to be shut down after use, Powered on status of the machine if user is assigned, Powered on status of the machine during peak period if user is assigned , the published name of the machine, the delivery type, and the AppDisk name.
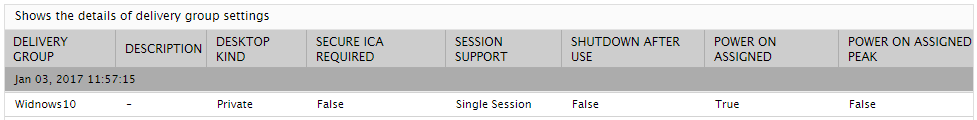
Figure 1 : The detailed diagnosis of the Is delivery group available? measure
The detailed diagnosis of the Used machines measure provides complete details of the machines in use such as the machine name, the IP address, the delivery group and catalog to which it belongs, the operating system it runs on and the version of the OS, the hypervisor to which the machine is connected, the user accessing the session, the name of the DNS server with which it communicates, and the machine type - whether Private or Shared, the name of the controller, the location of the changes made by the user, the provisioning type of the machine, the applications that are published on the machine etc.
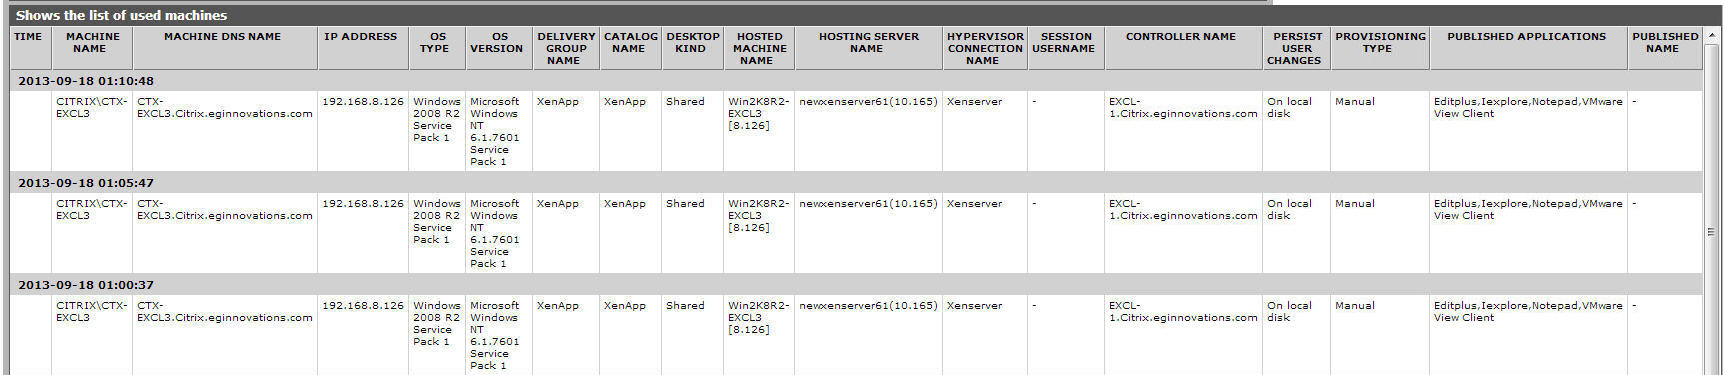
Figure 2 : The detailed diagnosis of the Used machines measure
The detailed diagnosis of the Unavailable machines measure will reveal the complete details of the unavailable machines, such as, the machine name, IP address, the machine type, the delivery group and catalog to which the machine belongs, the hosting server on which the machine operates, the name of the hypervisor and the controller on which the machine operates, the user who is active on the session, the location at whih the changes made by the user is stored, the provision type of the machine, the application published on the machine, if the machine is a XenApp etc.
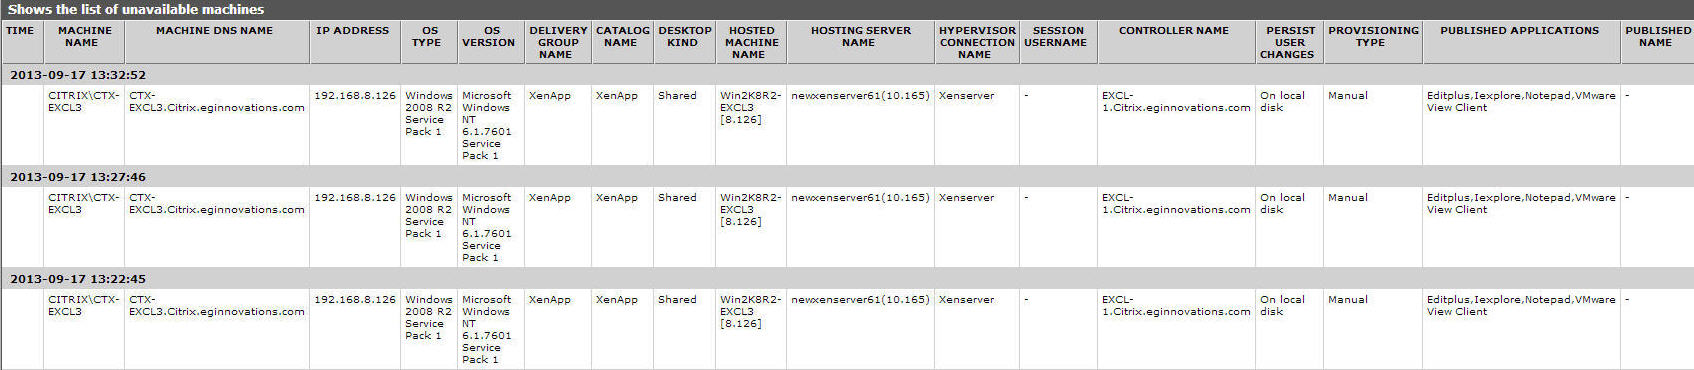
Figure 3 : The detailed diagnosis of the Unavailable machines measure
The detailed diagnosis of the Disconnected machines measure will reveal the complete details of the disconnected machines, such as, the machine name, IP address, OS type, OS version, the desktop type, the delivery group to which the machine belongs, the catalog to which the machine belongs, the hosting server on which the machine operates, the hypervisor connection, the name of the controller, location of the changes made by the user, provisioning type of this machine etc.
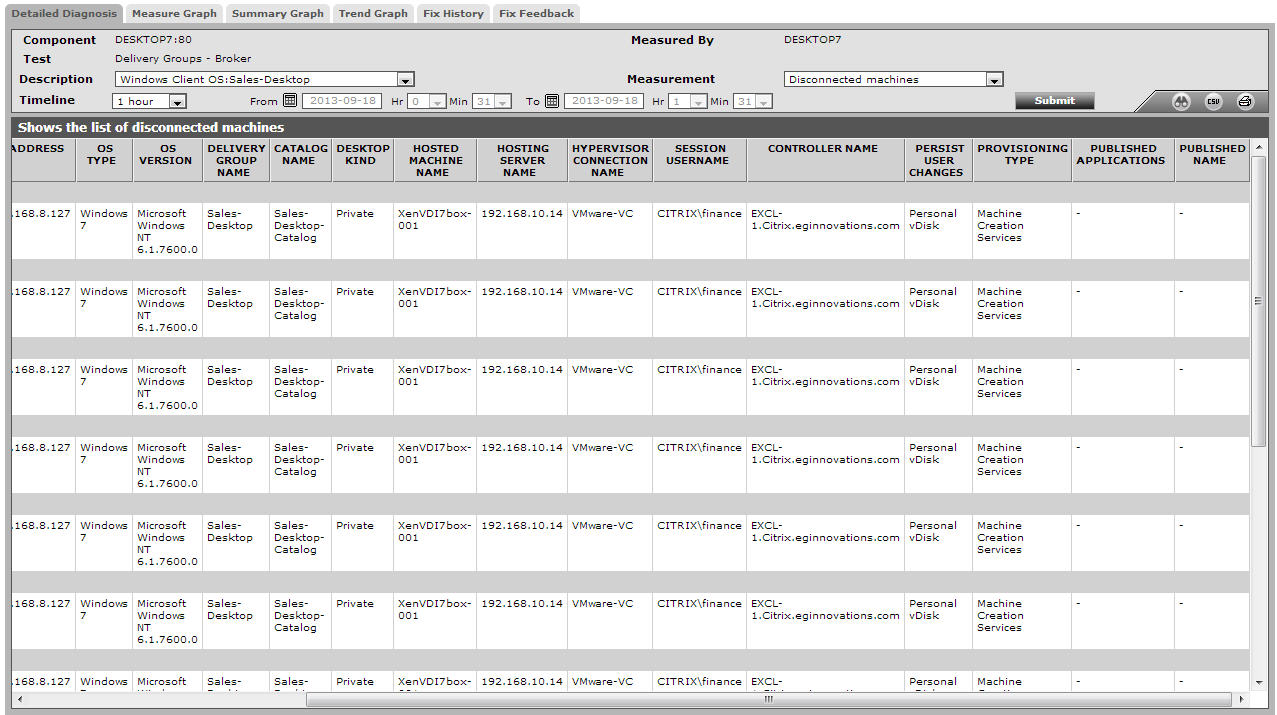
Figure 4 : The detailed diagnosis of the Disconnected machines measure
The detailed diagnosis of the Machines deregistered measure, lists the name of the machine, IP address, OS type and version, the delivery group and catalog to which the machine belongs, the desktop kind, the hosting server on which the machine operates, the hypervisor connection, the user who is currently accessing the session, name of the controller, the location of the changes made by the user, provisioning type, the applications published on the machine if the machine is a XenApp, the reason for deregistration of the machine and the actual time of deregistration etc.
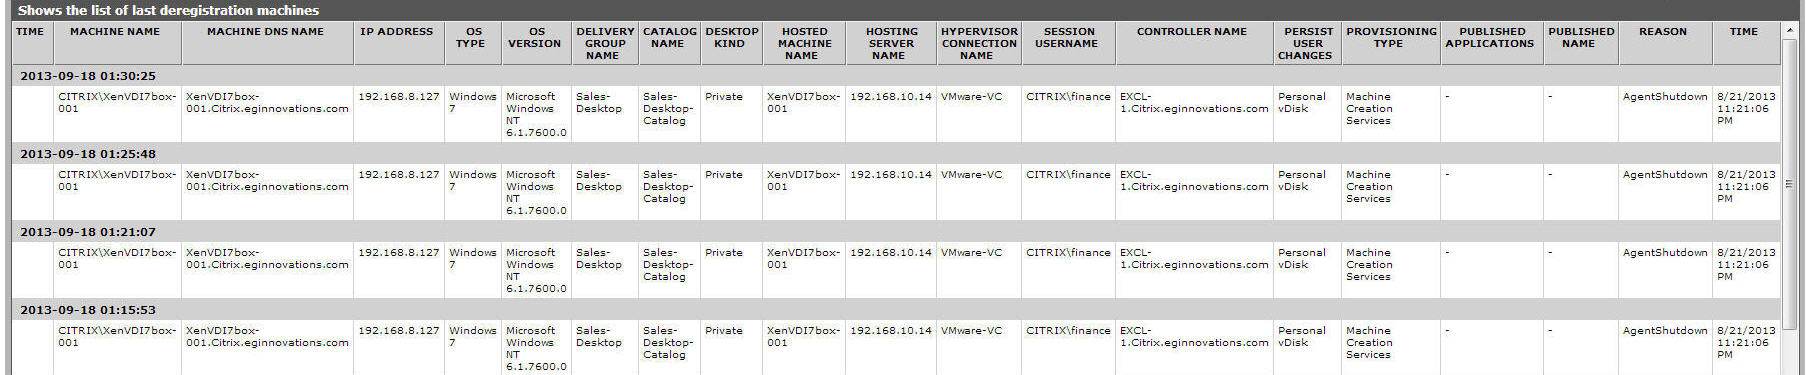
Figure 5 : The detailed diagnosis of the Last deregisteration machines measure
The detailed diagnosis of the Machines deregistered recently measure if enabled, lists the name of the machine, IP address, OS type and version, the delivery group and catalog to which the machine belongs, the desktop kind, the hosting server on which the machine operates, the hypervisor connection, the user who is currently accessing the session, name of the controller, the location of the changes made by the user, provisioning type, the name of the applications published on the machine if the machine is a XenApp, the reason for the machine to be deregistered from the broker, the time of deregistration etc.

Figure 6 : The detailed diagnosis of the Recent deregistration machines measure