English
 Deutsch
 Espanol
 Français
 Portuguese
 中文
中文 한국어
한국어 日本語
日本語




FAQ on Virtual Desktop Infrastructure
(VDI) monitoring
Many organizations have adopted virtual desktop infrastructures to securely allow access to their corporate networks and applications to remote users. Users login to a portal and once authenticated, they can access their virtual desktop from the browser itself, or through a separate client (e.g., Citrix Workspace App, Horizon client, etc.).
Given the experience that most organizations had during the Covid pandemic, where most employees had to work remotely from home, organizations have had to look at VDI technology for supporting remote workers. VDI is a key enabling technology supporting work-from-home.
There are many vendors who provide products that support virtual desktops. Citrix, VMware with Omnissa Horizon, Nutanix with Frame, Microsoft with Azure Virtual Desktops and AWS with Amazon WorkSpaces and Amazon AppStream are some of the key vendors.
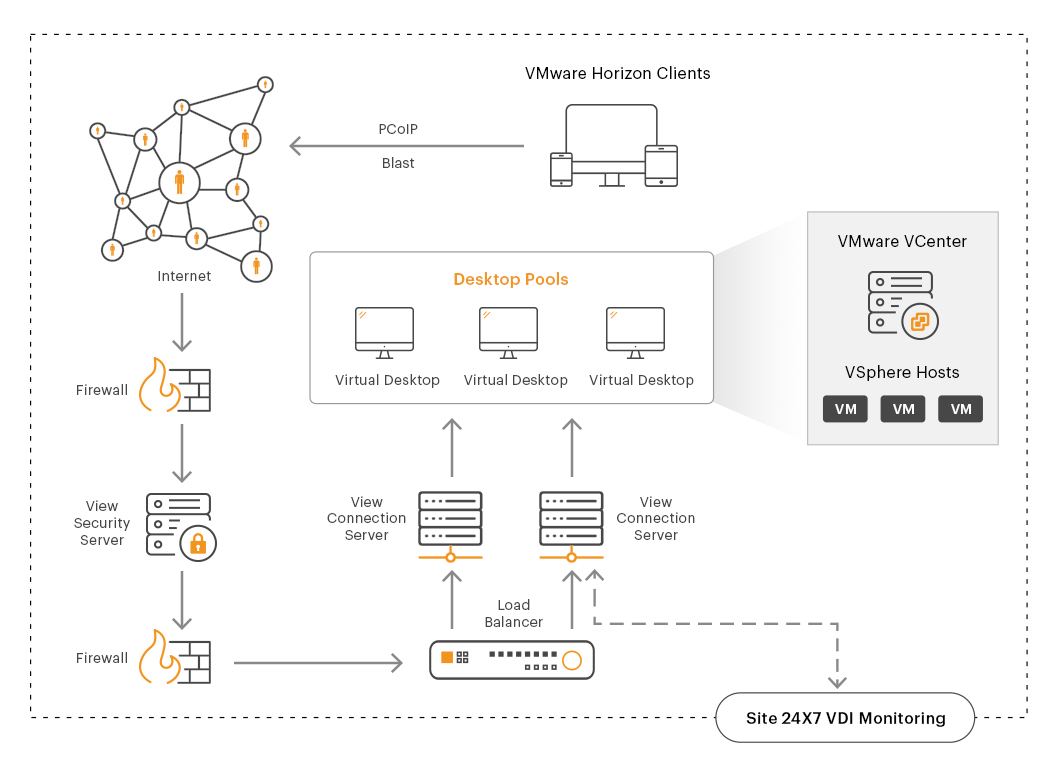
Figure 1: Architecture of a Omnissa Horizon VDI deployment
While the usage model for VDI is simple, there is a significant infrastructure required to support it. Figure 1 below shows a typical Omnissa Horizon based VDI infrastructure. As you can see, several hardware and software components are required to support virtual desktops.
- The Horizon Unified Access Gateway offers secure external access to your organization's applications. It is typically deployed in a demilitarized zone (DMZ).
- The Horizon Connection server is responsible for brokering user requests and assigning desktops to them.
- The virtual desktops are hosted on VMware vSphere hosts with VMware vCenter managing the vSphere hosts in clusters.
Access to the virtual desktops is using a remote protocol like HDX (Citrix), PCoIP or Blast (Omnissa Horizon), etc.
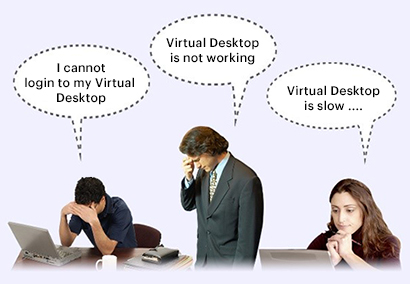
When a physical desktop has a problem, it impacts one user. VDI problems could impact hundreds or thousands of users. Consider a scenario where you have VDI deployed to support a thousand users and if your VMware vCenter goes down or is not reachable, no further user sessions can be established. Users logging into your VDI service will not be able to access corporate applications. If this issue lasts for an hour, that's a thousand hours of lost productivity. And this is just for one incident. If such an incident happens repeatedly, imagine the loss in productivity for an organization.
Slowness of VDI also affects user productivity. Read this case study where data entry operators reported significant frustration because the number of records they could enter per minute on a virtual desktop was significantly less when compared to what they were able to do with a physical desktop.
So all in all, proactive monitoring of VDI is important.
VDI monitoring is not just about monitoring resources. In fact, although virtual desktops are just virtual machines, IT admins cannot just use the same tools and techniques they used for monitoring virtual servers for monitoring VDI. Read our blog on this topic.
Digital user experience is the most important measure of VDI performance. VDI monitoring tools should be able to monitor all aspects of VDI user experience: logon time, application launch time, screen latency, bandwidth available, etc.
Since there are many tiers of software and hardware involved in supporting a VDI service, any issues, in any of these tiers will impact the VDI service. For example, if a Connection server is down, users may not be able to access their virtual desktops, or if a vSphere host is overloaded, users will experience slowness (e.g., slow screen refresh, screen freezes, disconnects, etc). Identifying and resolving such situations is a key to delivering great VDI user experience. This is where VDI monitoring tools come in.
The VDI technology providers do include some monitoring capabilities. The Citrix stack includes multiple tools – Citrix Director for session monitoring, Citrix ADM for insights into data flows through Citrix ADCs, Citrix analytics for performance, etc. Omnissa Horizon has vRealize Operations for Horizon for performance monitoring. Microsoft Azure includes Azure Monitor. Some of the challenges with these tools include:

- Lack of end to end monitoring capabilities. The monitoring tools track the different VDI tiers provided by the same vendor, but do not cover the supporting infrastructure. For example, with Citrix Director, you cannot get insights into the virtualization platform, Active Directory or storage.
- Inability to provide a 360 degree view of performance. To troubleshoot problems effectively, IT admins need insights into all aspects of performance and insights into every layer and every tier of the infrastructure. Many of these tools have limited insights inside the virtual desktops. They collect few metrics about the virtual desktop, or none at all.
- No single pane of glass across VDI technologies. Citrix’s tools monitor the Citrix stack, VMware’s tools focus on the VMware stack. According to a recent digital workspace survey by eG Innovations and xenappblog, 54% of organizations are using multiple digital workspace technologies in conjunction. In such a case, the vendor-specific tools do not provide a single pane of glass across the different VDI technologies used. Shuffling between monitoring consoles and analyzing performance issues across tools is cumbersome and time consuming for IT admins.
- A VDI monitoring tool must track user experience in real-time and alert administrators when slowness is detected.
- To troubleshoot slowness, the VDI monitoring tool must be able to monitor every layer and every tier of the virtual desktop infrastructure. Since usage or applications running in the virtual desktop can also cause slowness, the VDI monitoring tool must be able to collect performance indicators from within the virtual desktop as well. Read our blog on why monitoring must provide a 360o view of VMs here.
- To help VDI administrators troubleshoot problems quickly, the VDI monitoring tool should have built-in AIOps capabilities to correlate performance across VDI tiers and pinpoint where the bottlenecks lie.
- Since a VDI monitoring tool collects thousands of metrics, it can analyze these metrics and provide interesting insights – for right-sizing, capacity planning and optimization of VDI.
eG Enterprise is a total performance monitoring solution for VDI:
- eG Enterprise is a single console for organizations looking to monitor any type of digital workspace technologies.
- Based on years of experience working with the largest digital workspace deployments, eG Enterprise embeds specialized monitoring capabilities for virtual applications and virtual desktops.
- The auto-discovery, auto-monitoring and auto-diagnosis capabilities using AIOps technologies built into eG Enterprise make it simple to operate the solution. Organizations can provide role-based access to different IT stakeholders – executives, helpdesk teams, architects, etc.
- A wealth of analytics and reporting capabilities specific to digital workspace needs are embedded out of the box.
Read expert reviews of eG Enterprise here.
Typical benefits include:
- Proactive detection of problems, so you can detect and fix them before users complain
- Enhanced service uptime and increased user satisfaction
- Reduced MTTR as your IT team will be able to pinpoint the cause of problems quickly and accurately
- Increase in IT efficiency because your helpdesk will be able to direct problems to the right experts, and this will result in fewer bridge calls and tiger team meetings for your IT experts
- Increase in ROI as you will be able to right-size and optimize your infrastructure
Yes, VDI monitoring is simple to deploy. Most VDI monitoring tools auto-discover and manage your infrastructure. Agent deployments can be done automatically, and you can be monitoring your virtual desktops in minutes.
Typically, VDI monitoring uses a combination of agent and agentless monitoring. Monitoring of network devices, load balancers, virtualization platforms, cloud environments, etc. is done using agentless approaches, while you do need to deploy agents on the core VDI systems that broker and manage sessions to virtual desktops. Learn more about agent vs. agentless monitoring here.
Yes, this is a core capability of any VDI monitoring tool. User logins and logouts are tracked and idle time in a session is also monitored. VDI productivity reports document these metrics for all users. You can learn more about VDI reports here.
VDI monitoring solutions collect a variety of metrics about all aspects of VDI access. They can provide a wealth of reports regarding who logged in, when did they login, how long did they access the VDI, which VDI were they on, what applications did they use and for how long, what resources did they use, what experience did they see when accessing VDI and so on.
Yes, you can get free trials of VDI monitoring solutions. To test drive eG Enterprise, please register here.