Monitor your entire Wildfly infrastructure within a single-pane-of-glass and get visibility into the performance of your JVM, web and EJB containers, application code, database connections, slow queries, external service calls, and more.
Free TrialTrusted by leading companies

WildFly, previously recognized as JBoss AS, is a lightweight, high-performance application server developed by JBoss and maintained by Red Hat. Built in Java, it supports the Java Platform, Enterprise Edition (Java EE) standards, enabling the deployment of robust enterprise applications.
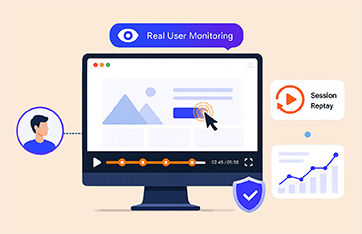
eG Enterprise offers comprehensive monitoring to ensure enhanced performance for WildFly environments, along with end-to-end visibility. From application code to database queries, it allows IT teams to proactively detect issues, optimize server performance, and ensure seamless user experience across Java EE-based applications.
The Wildfly application server is widely used for building, deploying, and hosting highly-transactional Java applications and services. To ensure high application performance, it is essential to monitor the Wildfly application server, the components it hosts and the infrastructure tiers supporting it. IT teams and developers need this capability in order to proactively detect performance problems before they impact end-users of the Java application.
Common challenges faced by administrators:


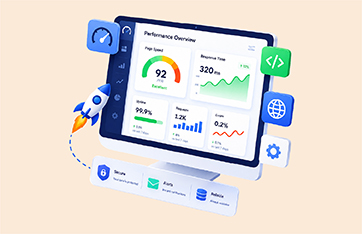
eG Enterprise provides a single-pane-of-glass view of the entire Wildfly infrastructure. From an intuitive web console, application owners, developers and administrators can monitor the full Java stack including the JVM, web and EJB containers, application code, database connections, slow queries, external service calls, and more.

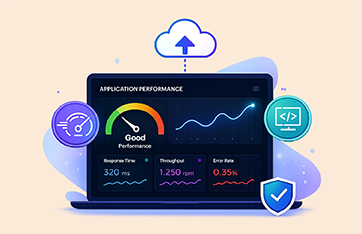
eG Enterprise helps you enhance the performance of your Wildfly applications:
eG Innovations delivers a robust, reliable and extremely valuable solution to deliver maximum uptime and user satisfaction. Pre-emptive alerting helps us to address performance issues immediately before they affect system and application availability.![]()


Automatic correlation with server-side issues, resource deficiency (CPU, memory, disk, etc.), and hardware faults differentiates application issues from the infrastructure.
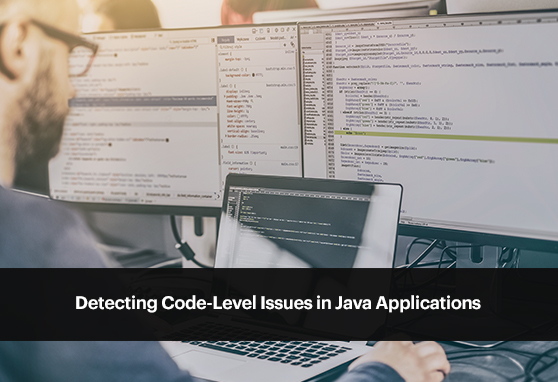
eG Enterprise allows developers to easily identify Java code-level issues.


eG Enterprise delivers total performance assurance for web applications powered by Java technology: