K8s Jobs by Namespace Test
A Job creates one or more Pods and ensures that a specified number of them successfully terminate. As pods successfully terminate, the Job tracks how many Pods completed their tasks successfully. When a specified number of successful completions is reached, the task (ie, Job) is complete.
Jobs are useful for large computation and batch-oriented tasks. Jobs can be used to support parallel execution of Pods. You can use a Job to run independent but related work items in parallel: sending emails, rendering frames, transcoding files, scanning database keys, etc.
In the real world, failure of such tasks can degrade the performance of business-critical applications managed by the Kubnernetes system. Likewise, delays in Job execution can also significantly delay the delivery of key business services that overlay the Kubernetes cluster. To ensure peak application/service performance at all times, it is imperative that administrators track the status and duration of each Job that is run on Kubernetes, promptly capture Job failures and slowness, rapidly determine the reason why a Job failed, and swiftly fix it. This is where the Jobs by Namespaces test helps!
This test auto-discovers the namespaces configured in the Kubernetes system, and for each namespace, reports the count of Jobs in different operational states. In the process, the test brings failed and slow Jobs to light. Detailed diagnostics of the test describes the failed and slow Jobs and also provides the reason why Jobs failed. Administrators can use this information to effectively troubleshoot the failure. Additionally, the test reports the status of Pods created by the Jobs, and alerts administrators if any Job resulted in Pod failures.
Target of the test : A Kubernetes/OpenShift Cluster
Agent deploying the test : A remote agent
Outputs of the test : One set of results for each namespace in the Kubernetes/OpenShift cluster being monitored
| Parameter | Description |
|---|---|
|
Test Period |
How often should the test be executed. |
|
Host |
The IP address of the host for which this test is to be configured. |
|
Port |
Specify the port at which the specified Host listens. By default, this is 6443. |
|
Load Balancer / Master Node IP |
To run this test and report metrics, the eG agent needs to connect to the Kubernetes API on the master node and run API commands. To enable this connection, the eG agent has to be configured with either of the following:
By default, this parameter will display the Load Balancer / Master Node IP that you configured when manually adding the Kubernetes/OpenShift cluster for monitoring, using the Kubernetes/OpenShift Cluster Preferences page in the eG admin interface (see Figure 3). The steps for managing the cluster using the eG admin interface are discussed elaborately in How to Monitor the Kubernetes/OpenShift Cluster Using eG Enterprise? Whenever the eG agent runs this test, it uses the IP address that is displayed (by default) against this parameter to connect to the Kubernetes API. If there is any change in this IP address at a later point in time, then make sure that you update this parameter with it, by overriding its default setting. |
|
K8s Cluster API Prefix |
By default, this parameter is set to none. Do not disturb this setting if you are monitoring a Kubernetes/OpenShift Cluster. To run this test and report metrics for Rancher clusters, the eG agent needs to connect to the Kubernetes API on the master node of the Rancher cluster and run API commands. The Kubernetes API of Rancher clusters is of the default format: http(s)://{IP Address of kubernetes}/{api endpoints}. The Server section of the kubeconfig.yaml file downloaded from the Rancher console helps in identifying the Kubernetes API of the cluster. For e.g., https://{IP address of Kubernetes}/k8s/clusters/c-m-bznxvg4w/ is usually the URL of the Kubernetes API of a Rancher cluster. For the eG agent to connect to the master node of a Rancher cluster and pull out metrics, the eG agent should be made aware of the API endpoints in the Kubernetes API of the Rancher cluster. To aid this, you can specify the API endpoints available in the Kubernetes API of the Rancher cluster against this parameter. In our example, this parameter can be specified as: /k8s/clusters/c-m-bznxvg4w/. |
|
SSL |
By default, the Kubernetes/OpenShift cluster is SSL-enabled. This is why, the eG agent, by default, connects to the Kubernetes API via an HTTPS connection. Accordingly, this flag is set to Yes by default. If the cluster is not SSL-enabled in your environment, then set this flag to No. |
|
Authentication Token |
The eG agent requires an authentication bearer token to access the Kubernetes API, run API commands on the cluster, and pull metrics of interest. The steps for generating this token have been detailed in How Does eG Enterprise Monitor a Kubernetes/OpenShift Cluster?
Typically, once you generate the token, you can associate that token with the target Kubernetes/OpenShift cluster, when manually adding that cluster for monitoring using the eG admin interface. The steps for managing the cluster using the eG admin interface are discussed elaborately in How to Monitor the Kubernetes/OpenShift Cluster Using eG Enterprise? By default, this parameter will display the Authentication Token that you provided in the Kubernetes Cluster Preferences page of the eG admin interface, when manually adding the cluster for monitoring (see Figure 3). Whenever the eG agent runs this test, it uses the token that is displayed (by default) against this parameter for accessing the API and pulling metrics. If for any reason, you generate a new authentication token for the target cluster at a later point in time, then make sure you update this parameter with the change. For that, copy the new token and paste it against this parameter. |
|
Job Age In Seconds |
By default, this parameter is set to 300 seconds. This means that, by default, this test will count any Job that runs for a duration over 300 seconds as a Longest running Job. You can override this default setting by specifying a different duration (in seconds) value here. |
|
Proxy Host |
If the eG agent connects to the Kubernetes API on the master node via a proxy server, then provide the IP address of the proxy server here. If no proxy is used, then the default setting -none - of this parameter, need not be changed, |
|
Proxy Port |
If the eG agent connects to the Kubernetes API on the master node via a proxy server, then provide the port number at which that proxy server listens here. If no proxy is used, then the default setting -none - of this parameter, need not be changed, |
|
Proxy Username, Proxy Password, Confirm Password |
These parameters are applicable only if the eG agent uses a proxy server to connect to the Kubernetes/OpenShift cluster, and that proxy server requires authentication. In this case, provide a valid user name and password against the Proxy Username and Proxy Password parameters, respectively. Then, confirm the password by retyping it in the CONFIRM PASSWORD text box. If no proxy server is used, or if the proxy server used does not require authentication, then the default setting - none - of these parameters, need not be changed. |
|
DD Frequency |
Refers to the frequency with which detailed diagnosis measures are to be generated for this test. The default is 1:1. This indicates that, by default, detailed measures will be generated every time this test runs, and also every time the test detects a problem. You can modify this frequency, if you so desire. Also, if you intend to disable the detailed diagnosis capability for this test, you can do so by specifying none against DD frequency. |
|
Detailed Diagnosis |
To make diagnosis more efficient and accurate, the eG Enterprise embeds an optional detailed diagnostic capability. With this capability, the eG agents can be configured to run detailed, more elaborate tests as and when specific problems are detected. To enable the detailed diagnosis capability of this test for a particular server, choose the On option. To disable the capability, click on the Off option. The option to selectively enable/disable the detailed diagnosis capability will be available only if the following conditions are fulfilled:
|
| Measurement | Description | Measurement Unit | Interpretation |
|---|---|---|---|
|
Completed jobs |
Indicates the number of Jobs in this namespace that have completed execution. |
Number |
A non-parallel Job is one that creates only one Pod. Such a Job is said to have completed if that Pod terminates successfully. On the other hand, a parallel Job is one that creates multiple Pods. In the case of such Jobs, you need to specify the desired number of completions using the completions field in your Job specification. A parallel Job is said to have completed only if the desired number of Pods terminate successfully. A high value is desired for this measure. |
|
Failed jobs |
Indicates the number of Jobs in this namespace that failed. |
Number |
A Job is said to have failed if the specified number of Pods could not complete the tasks. By default, a Job will run uninterrupted unless a Pod fails (restartPolicy=Never) or a Container exits in error (restartPolicy=OnFailure). At which point, the Job will retry Pod creation. However, there are situations where you want to fail a Job after some amount of retries due to a logical error in configuration etc. To do so, set .spec.backoffLimit to specify the number of retries before considering a Job as failed. The back-off limit is set by default to 6. Once .spec.backoffLimit has been reached the Job will be marked as failed and any running Pods will be terminated. Another way to fail a Job is by setting an active deadline. Do this by setting the .spec.activeDeadlineSeconds field of the Job to a number of seconds. The activeDeadlineSeconds applies to the duration of the Job, no matter how many Pods are created. Once a Job reaches activeDeadlineSeconds, all of its running Pods are terminated and the Job status will become type: Failed with reason: DeadlineExceeded. Note that a Job’s .spec.activeDeadlineSeconds takes precedence over its .spec.backoffLimit. Therefore, a Job that is retrying one or more failed Pods will not deploy additional Pods once it reaches the time limit specified by activeDeadlineSeconds, even if the backoffLimit is not yet reached. Ideally, the value of this measure should be 0. If the measure reports a non-zero value, then you can use the detailed diagnosis of this measure to know which Jobs failed and why. |
|
Running pods |
Indicates the number of Pods created by Jobs in this namespace, which are currently in the Running state. |
Number |
If a Pod is in the Running state, it means that the Pod has been bound to a node, and all of the Containers have been created. At least one Container is still running, or is in the process of starting or restarting. |
|
Failed pods |
Indicates the number of Pods created by Jobs in this namespace, which are currently in the Failed state. |
Number |
If a Pod is in the Failed state, it means that all Containers in the Pod have terminated, and at least one Container has terminated in failure. That is, the Container either exited with non-zero status or was terminated by the system. |
|
Succeeded pods |
Indicates the number of Pods created by Jobs in this namespace, which are currently in the Succeeded state. |
Number |
If a Pod is in the Succeeded state, it means that all Containers in the Pod have terminated in success, and will not be restarted. |
|
Longest running jobs |
Indicates the number of Jobs in this namespace that have been running for a duration greater than the value of the Job AGE SECONDS parameter. |
Number |
Ideally, the value of this measure should be 0. If this measure reports a non-zero value, then use the detailed diagnosis of this measure to know which Jobs are executing for a long time. |
|
Active cron jobs |
Indicates the number of cron Jobs that are currently active in this namespace. |
Number |
A Cron Job creates Jobs on a time-based schedule. One CronJob object is like one line of a crontab (cron table) file. It runs a Job periodically on a given schedule, written in Cron format. |
To know which Jobs in a namespace have been running for a long time, use the detailed diagnosis of the Longest running jobs measure.
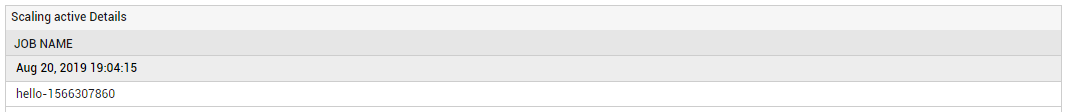
Figure 1 : The detailed diagnosis of the Longest running jobs measure