Beyond Omnissa Horizon, eG Innovations includes purpose-built, fully integrated modules for other VMware technologies and even third-party products likely to be used alongside Horizon. Technologies supported include the Blast Extreme protocol, VMware Unified Access Gateway (UAG), thin clients, and of course, App Volumes. Today, I’ll focus on how to ensure that you can monitor VMware App Volumes both via full insights from App Volumes Manager but also via continuous monitoring of user endpoints.
App Volumes has been neglected by most monitoring vendors and freeware; probably owing to the need to develop domain-aware supported components so many other products utilize unsupported manual scripts to provide some coverage without the costs of R&D. VMware themselves have done a very good job of making App Volumes data available to monitoring vendors.
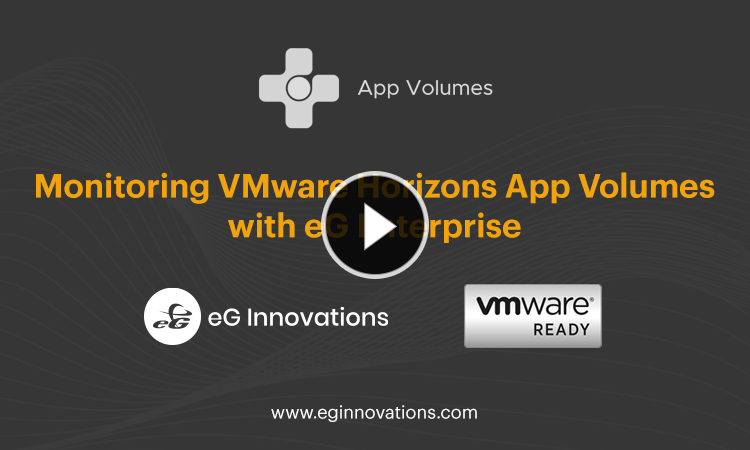
I’ll cover what is possible if a product integrates beyond scripting. We’ve also put a short overview video together showing eG Enterprise’s layered model UI (User Interface) actively monitoring App Volumes so you can see the visuals for yourself:
If you are experience issues and are troubleshooting App Volumes, you might want to visit VMware’s troubleshooting page, here.
What is App Volumes?
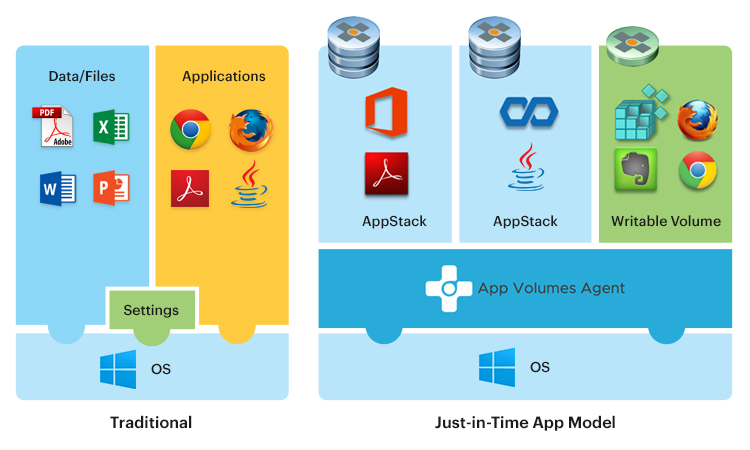
VMware App Volumes is a real-time application delivery system that enterprises use to dynamically deliver and manage applications and their lifecycle. Applications are bundled in AppStacks and are delivered by attaching a standard VMDK or VHD file to a virtual machine.
Administrators can centrally manage the applications with the App Volumes Manager, a Web-based interface that is integrated with Active Directory (AD) and vSphere. Administrators can assign, update, or remove applications at the next user login or in real time and there is no need to modify the desktops or individual applications. Writable Volumes allow users to access their application data across sessions and devices.
Applications delivered using App Volumes look and feel natively installed and you can update or replace the applications in real time.
With App Volumes, applications become VM-independent objects that can be moved easily across data centers or to the cloud and shared with thousands of virtual machines. In a virtual desktop environment, App Volumes provides many benefits.
The App Volumes Manager – The Need to Monitor Continuously
The VMware App Volumes Manager is a Windows Server used as the Web Console for administration and configuration and assignment of AppStacks and writable volumes. It is also used as a broker for the App Volumes Agents, for automated assignment of applications and writable volumes during desktop startup or user login.
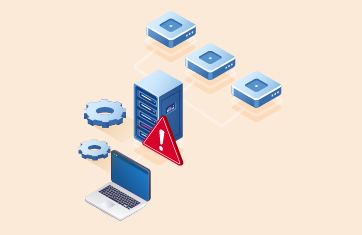
In environments where App Volumes is extensively used, if an AppStack could not be assigned to a user or if the user could not access the applications due to lack of storage space in the volumes, users are forced to wait till the AppStacks are made available or the storage space is increased. To avoid such poor user experience, it is necessary for the administrators to monitor the VMware App Volumes Manager round the clock! eG Enterprise helps administrators in this regard.
Moreover, eG Enterprise configures thresholds on App Volumes logs, metrics, events, and errors to trigger and then filter and correlate alerts via dashboards, alert consoles, emails/SMSes, or automated ticketing integrations with the likes of ServiceNOW, Slack, Jira, and others.
Monitoring the VMware App Volumes Manager
eG Enterprise offers a specialized VMware App Volumes Manager monitoring model, which monitors the license utilization, storage, AppStacks, and storage groups of the VMware App Volumes Manager and proactively alerts administrators to potential performance troubles.
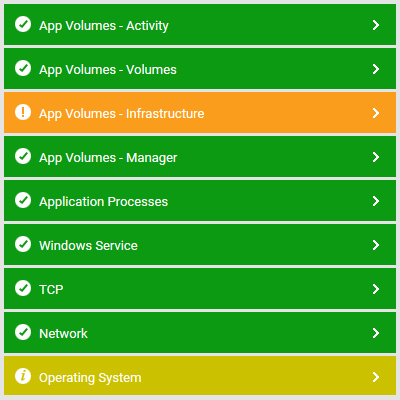
Each layer of the Figure 1 is mapped to a variety of tests that provide valuable insights into the overall health and performance of the target VMware App Volumes Manager. With the help of the metrics and statuses reported by these tests, you can find quick and accurate answers for the following questions:
- What is the availability and responsiveness of the target VMware AppVolumes Manager?
- What is the response code returned by the HTTP/HTTPS requests?
- How many AppStacks are managed by the target VMware AppVolumes Manager?
- How many users are logged in through the target VMware AppVolumes Manager?
- How many servers are provisioned through the target VMware AppVolumes Manager?
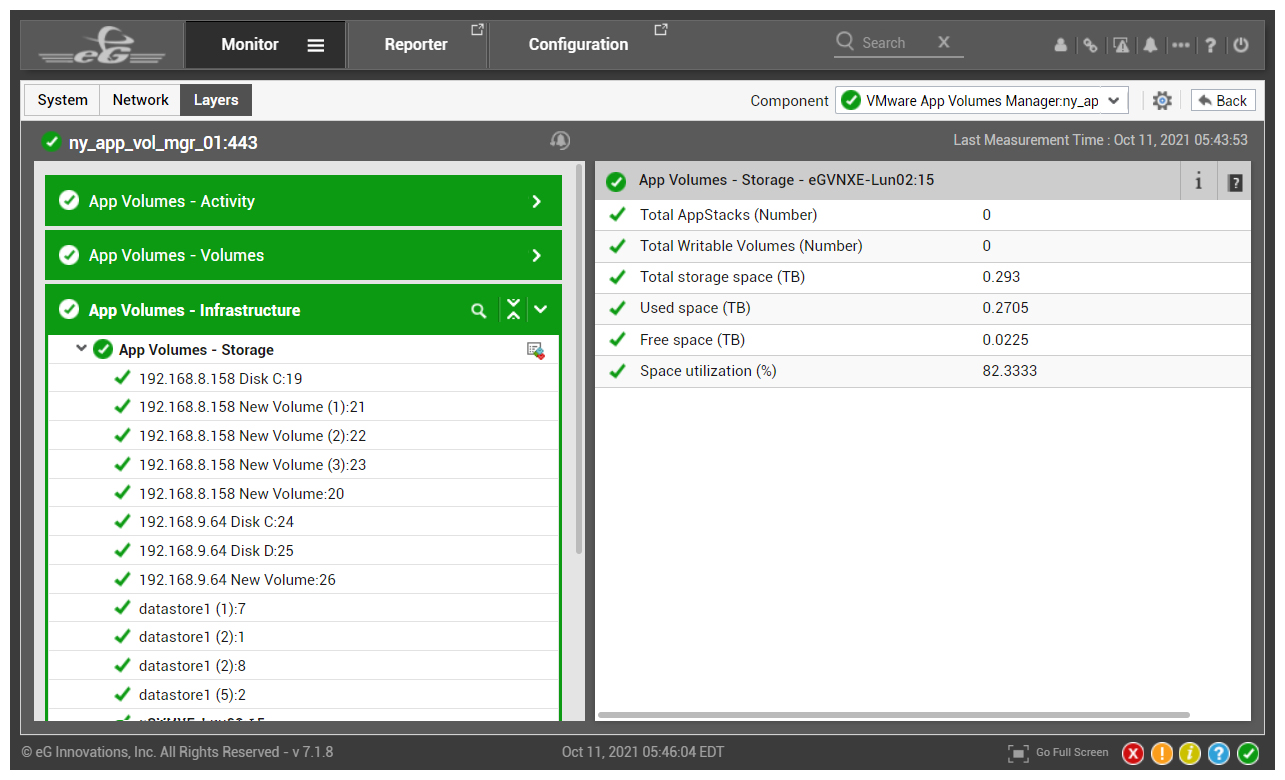
- What is the status of each writable volume?
- How much of space is available for use in each writable volume?
- What is the percentage of space utilized in each writable volume? Which writable volume is currently running out of space?
- What is the status of each AppStack?
- How many users are attached to each AppStack?
- How many applications are available in each AppStack?
- How many users are accessing each AppStack?
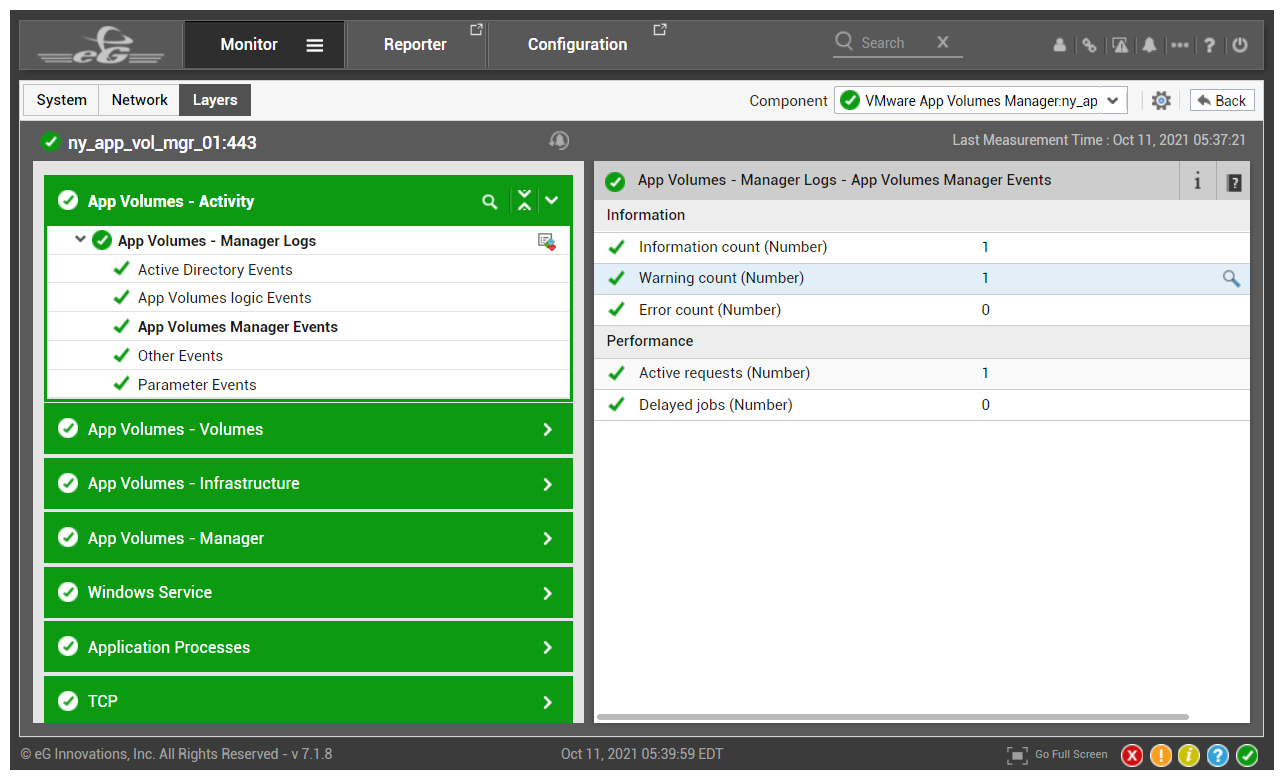
- How much information and how many warning messages were received for each event type by the target VMware AppVolumes Manager?
- How many error messages were received for each event type?
- How many jobs were delayed for each event type?
- What is the average time taken for the connections of each event type to succeed?
- How many datastores are available in each storage group?
- How much space is available for use in each storage group?
- What is the percentage of space utilized by each storage group?
- How many AppStacks and writable volumes are available in each datastore?
- How much of space is available for use in each datastore?
- What is the percentage of space utilized by each datastore? Which datastore is currently running out of space?
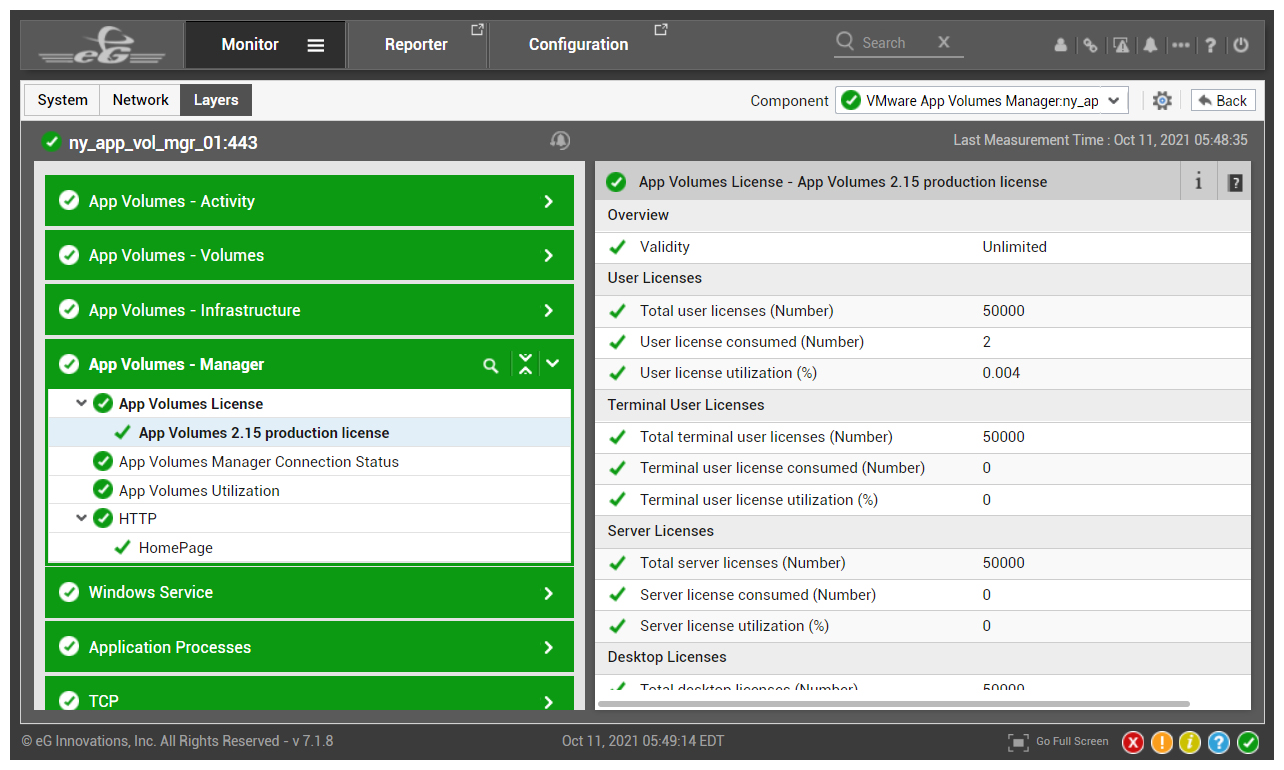
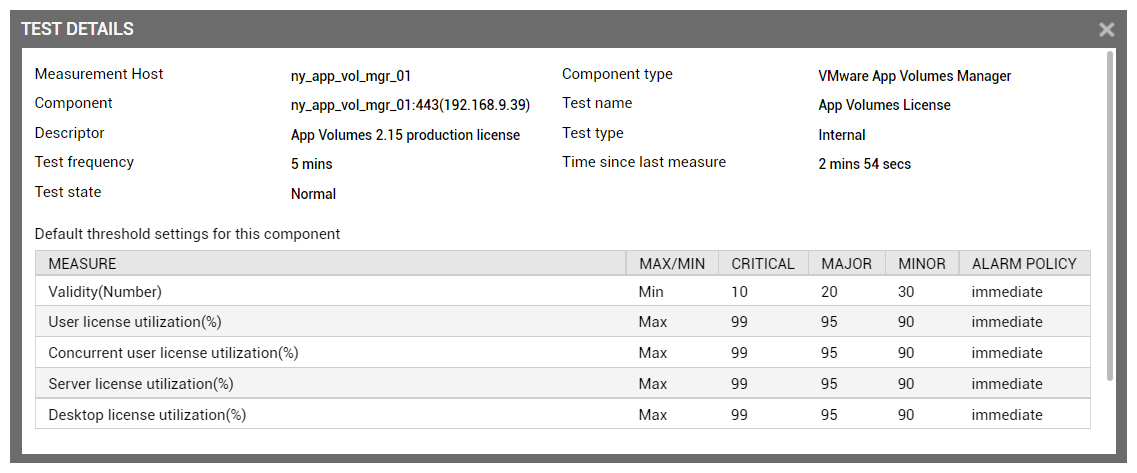
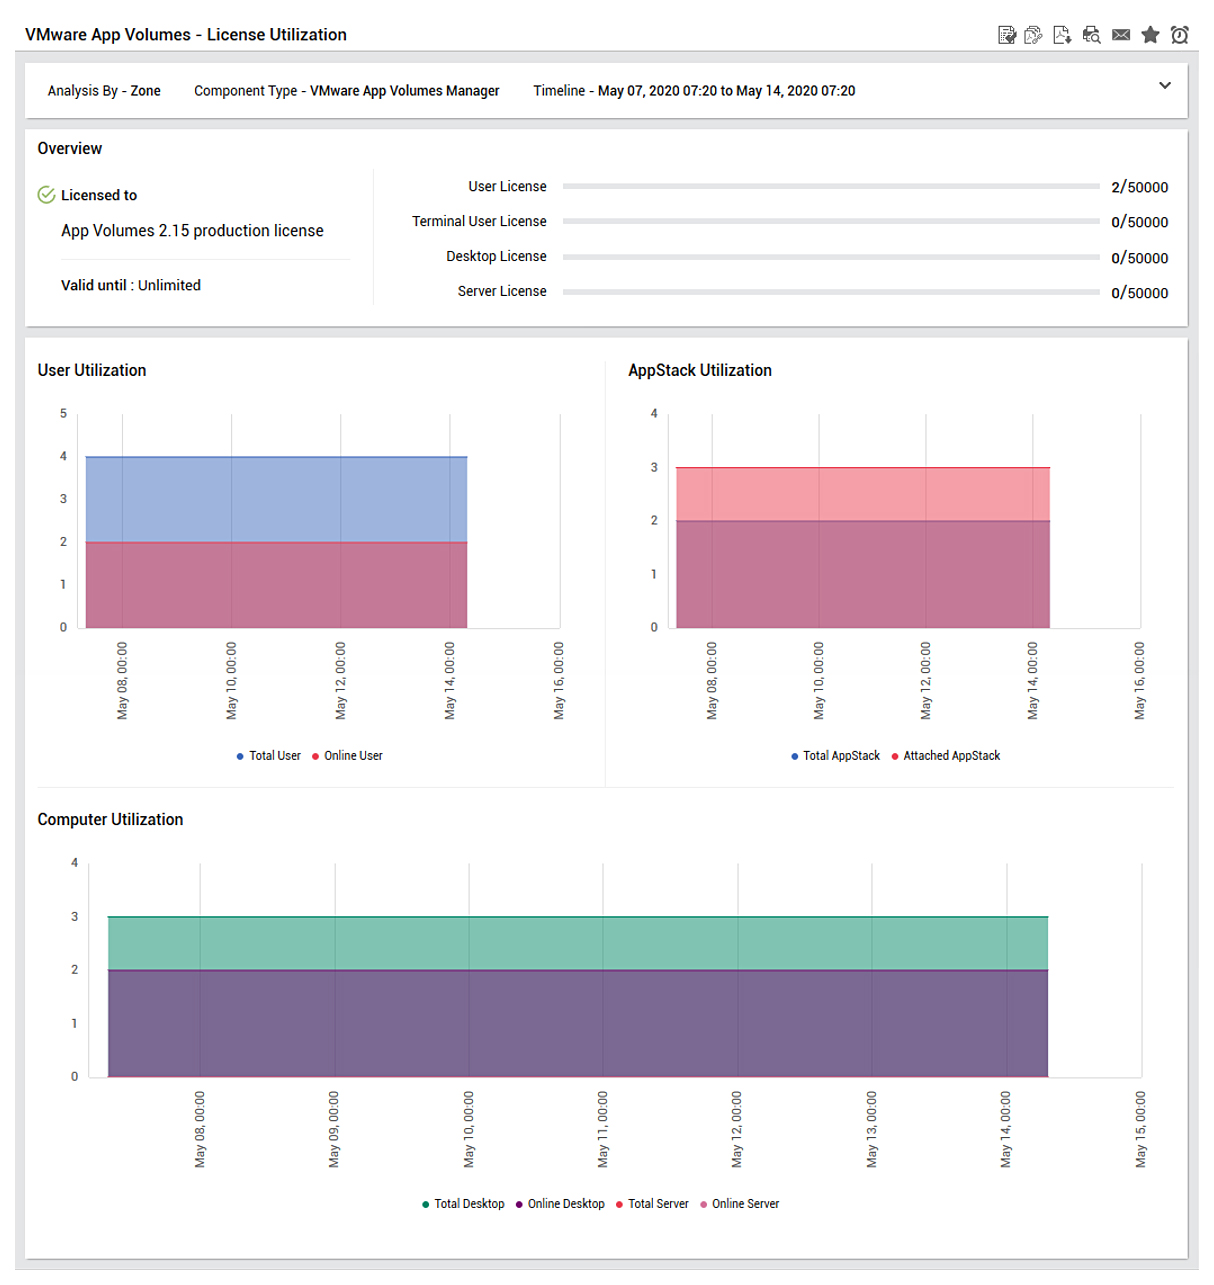
- What is the validity of the license provided for the target VMware App Volumes Manager?
- How many user licenses are allocated and how many are currently in use?
- What are the App Volumes mounts and durations for user sessions?
- And many more key metrics, events, and logs – detailed in our documentation (eG Enterprise monitors 40+ key criteria for App Volumes): Monitoring the VMware App Volumes Manager (eginnovations.com)
True Continuous Monitoring of App Volumes Manager Logs including Warnings and Errors
Monitors all key logs and errors and warnings proactively.
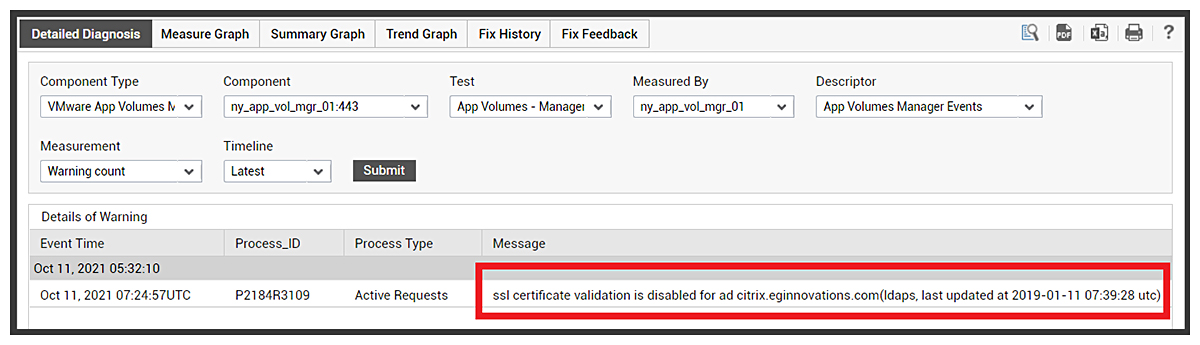
Instant access to the details of warnings or errors e.g., SSL certification problems and potential misconfigurations such as disabled certificates.
Auto-discovery and Out-of-the-box Alerting for all App Volumes Storage
Ensures that alert thresholds are automatically configured for all your App Volumes disks, so that alerts are raised before issues arise if storage capacity starts becoming a concern. The historical data retained ensures capacity planning is simple.
Instant Visibility into App Volumes Licensing
Continual monitoring of App Volumes licensing, including proactive threshold testing of concurrent user usage and thresholds.
Monitoring App Volume Health on the End-user VDI
Beyond the App Volume Manager components, App Volume monitoring is built into eG Enterprise’s vSphere VDI monitoring layers and components to ensure continuous health check analysis of VMware App Volumes on an endpoint is performed, rapidly and proactively reporting issues that impact users. Pre-configured out-of-the-box thresholds are automatically set to provide instant alerting of issues such as lengthy attachment duration times or availability issues accessing the App Volume Manager from the endpoint.
Data is collected and analyzed for every single login, ensuring not only instant alerting of issues but that data is available to the eG Enterprise reporting components so that long-term trends can be analyzed and gradual degradations identified. Correlating this data across users allows eG Enterprise to identify the root cause of App Volume issues and the scope of their impact, which may be geographical or associated with common infrastructure components.
If you are experiencing slow login times associated with App Volumes, you can find some self-service advice, here.
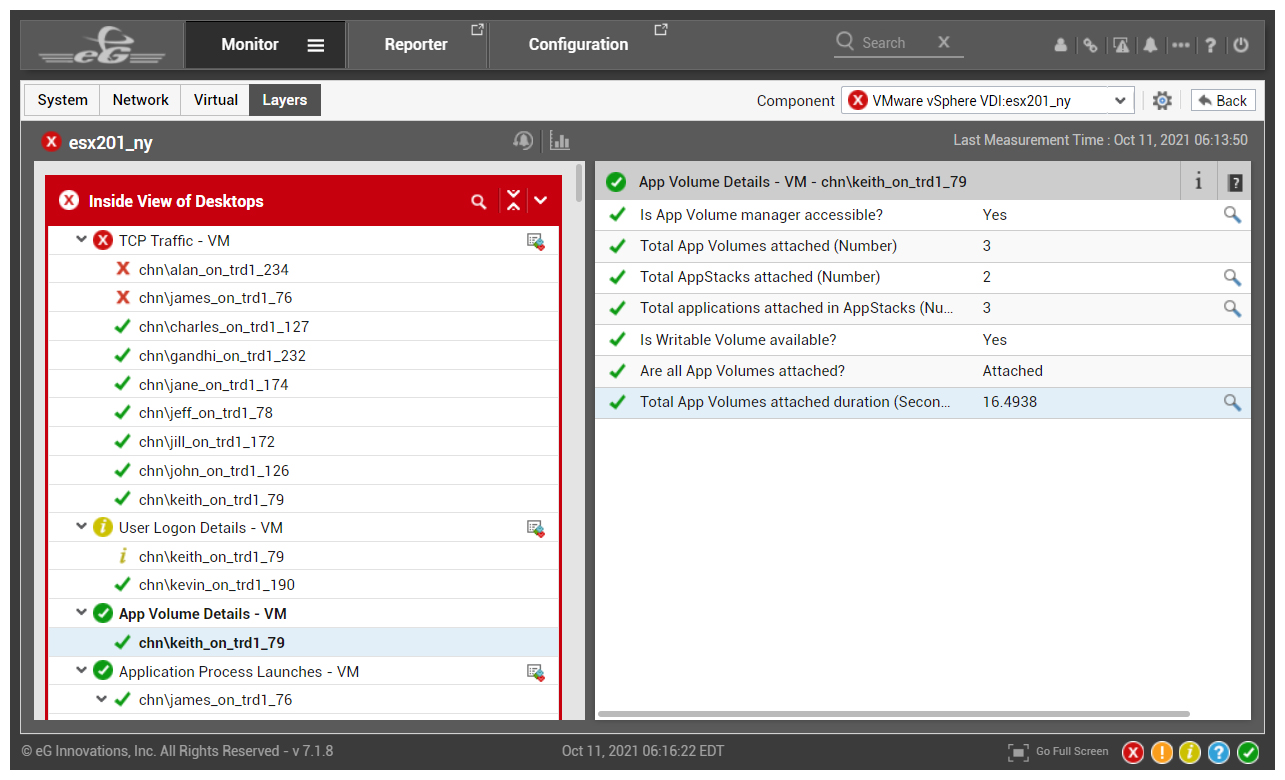
For every single user, critical metrics are collected within the end-user VMs and monitored for issues, including the “Total Volumes attached duration time”. Writable volumes are also monitored, a known source of pain with this technology.
Out-of-the-box Reporting for App Volumes
The core eG Enterprise product includes not only monitoring, but also live and historical report generation with out-of-the-box specific reports provided for App Volumes and other VMware components. App Volume reporting includes (links provided to detailed documentation):
- VMware App Volumes – License Utilization Report
- VMware App Volumes – AppStack Details Report
- VMware App Volumes – App Volumes User Details Report
- VMware App Volumes – AppStacks Assigned to Users Report
eG Enterprise is an Observability solution for Modern IT. Monitor digital workspaces,
web applications, SaaS services, cloud and containers from a single pane of glass.
eG Enterprise is an Observability solution for Modern IT. Monitor digital workspaces,
web applications, SaaS services, cloud and containers from a single pane of glass.
More Info:
- Watch a short overview video showing eG Enterprise’s layered model UI (User Interface) actively monitoring App Volumes
- Details of eG Enterprise support for Horizon environments: Omnissa Horizon Monitoring for VDI Performance
- 5 Key Capabilities That Your Omnissa Horizon Monitoring Solution Must Have – Omnissa Horizon Monitoring Solutions
- Top Omnissa Horizon Performance Challenges for VM Administrators – Omnissa Horizon Performance Challenges
- Both Rory Monaghan (Read blog) and Marius Sandbu (Read blog) have excellent articles covering the App Volumes architecture and use cases.
- Chris Hildebrandt from the VMUG community is a bit of an App Volumes guru and blogs about common issues – Random AppVolumes Fixes for common issues. | childebrandt42 (wordpress.com)
 Raja Kannan is Head of Technology Services at eG Innovations. Raja’s experience is in End-User Computing, Infrastructure Monitoring, and Application Performance Monitoring (APM).